Hispanic or Latino vs Palestinian College, 1 year or more
COMPARE
Hispanic or Latino
Palestinian
College, 1 year or more
College, 1 year or more Comparison
Hispanics or Latinos
Palestinians
51.1%
COLLEGE, 1 YEAR OR MORE
0.0/ 100
METRIC RATING
317th/ 347
METRIC RANK
62.0%
COLLEGE, 1 YEAR OR MORE
96.3/ 100
METRIC RATING
106th/ 347
METRIC RANK
Hispanic or Latino vs Palestinian College, 1 year or more Correlation Chart
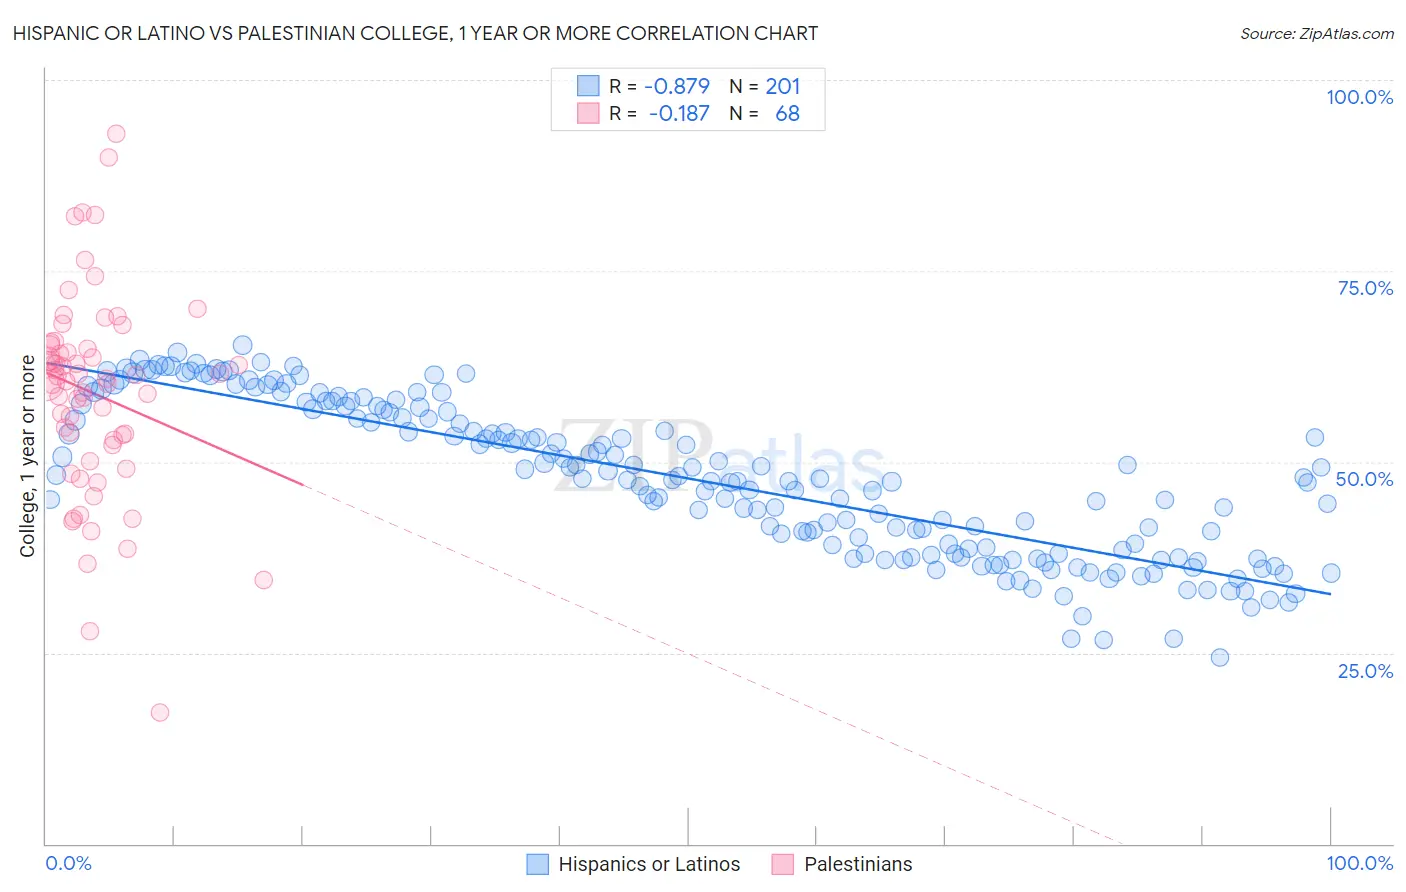
The statistical analysis conducted on geographies consisting of 578,586,619 people shows a very strong negative correlation between the proportion of Hispanics or Latinos and percentage of population with at least college, 1 year or more education in the United States with a correlation coefficient (R) of -0.879 and weighted average of 51.1%. Similarly, the statistical analysis conducted on geographies consisting of 216,461,838 people shows a poor negative correlation between the proportion of Palestinians and percentage of population with at least college, 1 year or more education in the United States with a correlation coefficient (R) of -0.187 and weighted average of 62.0%, a difference of 21.3%.
College, 1 year or more Correlation Summary
| Measurement | Hispanic or Latino | Palestinian |
| Minimum | 24.4% | 17.1% |
| Maximum | 65.3% | 92.9% |
| Range | 40.9% | 75.8% |
| Mean | 47.8% | 58.9% |
| Median | 47.8% | 60.7% |
| Interquartile 25% (IQ1) | 38.2% | 52.5% |
| Interquartile 75% (IQ3) | 57.0% | 65.1% |
| Interquartile Range (IQR) | 18.8% | 12.6% |
| Standard Deviation (Sample) | 10.0% | 13.4% |
| Standard Deviation (Population) | 10.0% | 13.3% |
Similar Demographics by College, 1 year or more
Demographics Similar to Hispanics or Latinos by College, 1 year or more
In terms of college, 1 year or more, the demographic groups most similar to Hispanics or Latinos are Cajun (51.2%, a difference of 0.090%), Immigrants from Honduras (51.0%, a difference of 0.13%), Guatemalan (51.2%, a difference of 0.16%), Immigrants from El Salvador (51.0%, a difference of 0.22%), and Kiowa (51.0%, a difference of 0.28%).
| Demographics | Rating | Rank | College, 1 year or more |
| Hondurans | 0.0 /100 | #310 | Tragic 51.6% |
| Immigrants | Haiti | 0.0 /100 | #311 | Tragic 51.5% |
| Pueblo | 0.0 /100 | #312 | Tragic 51.5% |
| Immigrants | Caribbean | 0.0 /100 | #313 | Tragic 51.4% |
| Fijians | 0.0 /100 | #314 | Tragic 51.3% |
| Guatemalans | 0.0 /100 | #315 | Tragic 51.2% |
| Cajuns | 0.0 /100 | #316 | Tragic 51.2% |
| Hispanics or Latinos | 0.0 /100 | #317 | Tragic 51.1% |
| Immigrants | Honduras | 0.0 /100 | #318 | Tragic 51.0% |
| Immigrants | El Salvador | 0.0 /100 | #319 | Tragic 51.0% |
| Kiowa | 0.0 /100 | #320 | Tragic 51.0% |
| Hopi | 0.0 /100 | #321 | Tragic 50.9% |
| Navajo | 0.0 /100 | #322 | Tragic 50.8% |
| Immigrants | Guatemala | 0.0 /100 | #323 | Tragic 50.7% |
| Immigrants | Cuba | 0.0 /100 | #324 | Tragic 50.7% |
Demographics Similar to Palestinians by College, 1 year or more
In terms of college, 1 year or more, the demographic groups most similar to Palestinians are Immigrants from Nepal (62.0%, a difference of 0.0%), Chilean (62.0%, a difference of 0.020%), Afghan (62.0%, a difference of 0.030%), Luxembourger (62.1%, a difference of 0.15%), and Icelander (62.1%, a difference of 0.17%).
| Demographics | Rating | Rank | College, 1 year or more |
| Croatians | 97.1 /100 | #99 | Exceptional 62.2% |
| Icelanders | 96.8 /100 | #100 | Exceptional 62.1% |
| Swedes | 96.8 /100 | #101 | Exceptional 62.1% |
| Luxembourgers | 96.7 /100 | #102 | Exceptional 62.1% |
| Afghans | 96.4 /100 | #103 | Exceptional 62.0% |
| Chileans | 96.4 /100 | #104 | Exceptional 62.0% |
| Immigrants | Nepal | 96.3 /100 | #105 | Exceptional 62.0% |
| Palestinians | 96.3 /100 | #106 | Exceptional 62.0% |
| Immigrants | Ukraine | 95.8 /100 | #107 | Exceptional 61.9% |
| Syrians | 95.7 /100 | #108 | Exceptional 61.9% |
| Immigrants | Northern Africa | 95.7 /100 | #109 | Exceptional 61.9% |
| Europeans | 95.6 /100 | #110 | Exceptional 61.8% |
| Macedonians | 95.6 /100 | #111 | Exceptional 61.8% |
| Austrians | 95.4 /100 | #112 | Exceptional 61.8% |
| Ukrainians | 95.2 /100 | #113 | Exceptional 61.8% |