Hispanic or Latino vs Hmong Master's Degree
COMPARE
Hispanic or Latino
Hmong
Master's Degree
Master's Degree Comparison
Hispanics or Latinos
Hmong
10.9%
MASTER'S DEGREE
0.0/ 100
METRIC RATING
316th/ 347
METRIC RANK
13.4%
MASTER'S DEGREE
4.0/ 100
METRIC RATING
238th/ 347
METRIC RANK
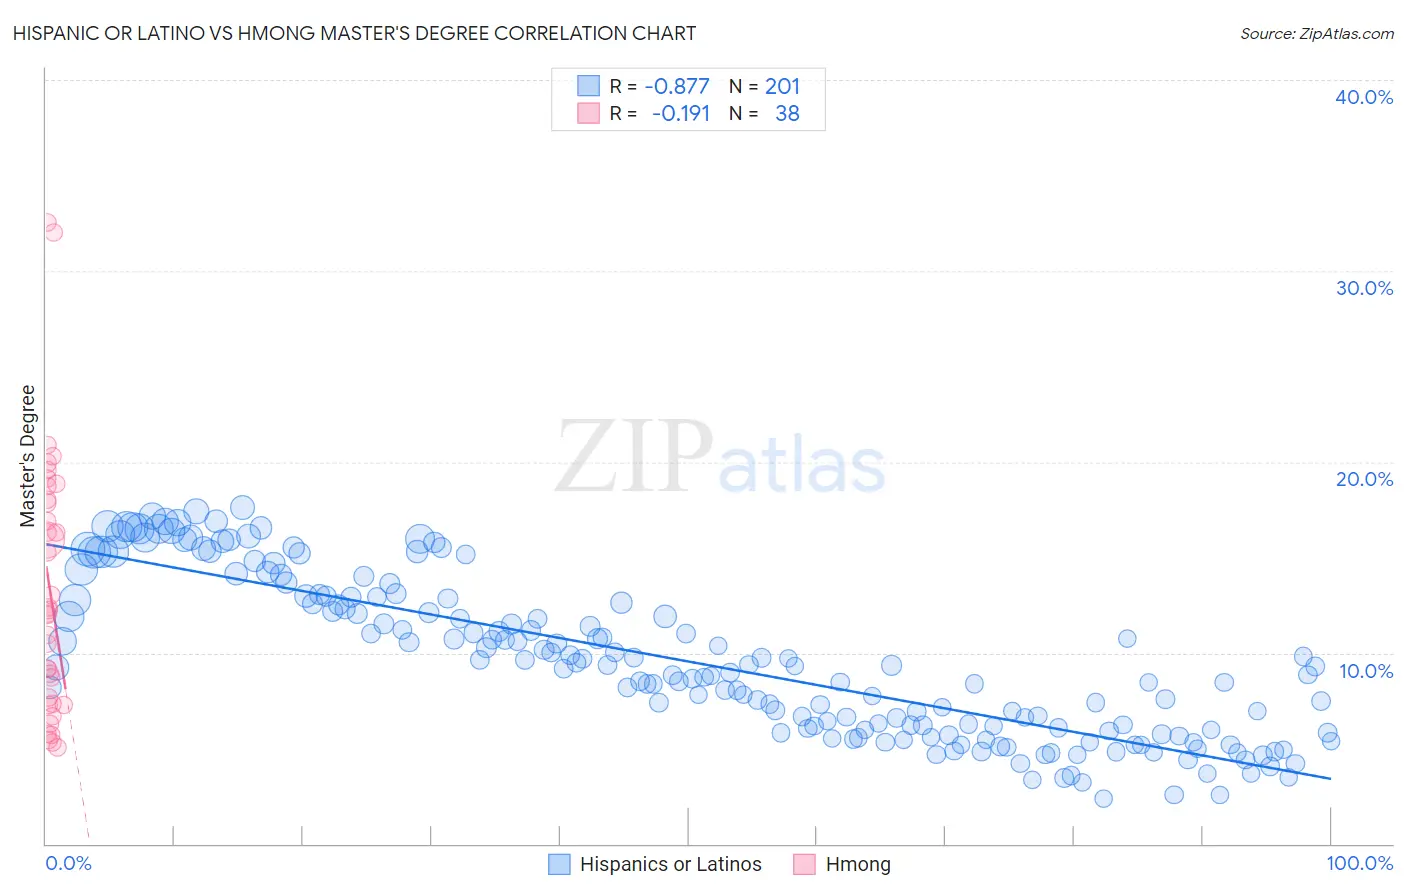
Hispanic or Latino vs Hmong Master's Degree Correlation Chart
The statistical analysis conducted on geographies consisting of 577,228,232 people shows a very strong negative correlation between the proportion of Hispanics or Latinos and percentage of population with at least master's degree education in the United States with a correlation coefficient (R) of -0.877 and weighted average of 10.9%. Similarly, the statistical analysis conducted on geographies consisting of 24,664,732 people shows a poor negative correlation between the proportion of Hmong and percentage of population with at least master's degree education in the United States with a correlation coefficient (R) of -0.191 and weighted average of 13.4%, a difference of 22.6%.
Master's Degree Correlation Summary
| Measurement | Hispanic or Latino | Hmong |
| Minimum | 2.4% | 5.0% |
| Maximum | 17.6% | 32.5% |
| Range | 15.2% | 27.5% |
| Mean | 9.5% | 13.3% |
| Median | 9.2% | 12.1% |
| Interquartile 25% (IQ1) | 5.9% | 7.3% |
| Interquartile 75% (IQ3) | 12.7% | 18.0% |
| Interquartile Range (IQR) | 6.8% | 10.7% |
| Standard Deviation (Sample) | 4.1% | 6.8% |
| Standard Deviation (Population) | 4.1% | 6.7% |
Similar Demographics by Master's Degree
Demographics Similar to Hispanics or Latinos by Master's Degree
In terms of master's degree, the demographic groups most similar to Hispanics or Latinos are Apache (11.0%, a difference of 0.34%), Cajun (11.0%, a difference of 0.35%), Hopi (10.9%, a difference of 0.54%), Immigrants from Cuba (10.9%, a difference of 0.67%), and Yaqui (11.0%, a difference of 0.74%).
| Demographics | Rating | Rank | Master's Degree |
| Puget Sound Salish | 0.0 /100 | #309 | Tragic 11.1% |
| Shoshone | 0.0 /100 | #310 | Tragic 11.1% |
| Seminole | 0.0 /100 | #311 | Tragic 11.0% |
| Choctaw | 0.0 /100 | #312 | Tragic 11.0% |
| Yaqui | 0.0 /100 | #313 | Tragic 11.0% |
| Cajuns | 0.0 /100 | #314 | Tragic 11.0% |
| Apache | 0.0 /100 | #315 | Tragic 11.0% |
| Hispanics or Latinos | 0.0 /100 | #316 | Tragic 10.9% |
| Hopi | 0.0 /100 | #317 | Tragic 10.9% |
| Immigrants | Cuba | 0.0 /100 | #318 | Tragic 10.9% |
| Kiowa | 0.0 /100 | #319 | Tragic 10.8% |
| Immigrants | Micronesia | 0.0 /100 | #320 | Tragic 10.8% |
| Pennsylvania Germans | 0.0 /100 | #321 | Tragic 10.7% |
| Sioux | 0.0 /100 | #322 | Tragic 10.7% |
| Crow | 0.0 /100 | #323 | Tragic 10.6% |
Demographics Similar to Hmong by Master's Degree
In terms of master's degree, the demographic groups most similar to Hmong are Jamaican (13.4%, a difference of 0.14%), Immigrants from Guyana (13.4%, a difference of 0.36%), German Russian (13.5%, a difference of 0.48%), Nonimmigrants (13.3%, a difference of 0.53%), and Immigrants from Burma/Myanmar (13.5%, a difference of 0.88%).
| Demographics | Rating | Rank | Master's Degree |
| Guyanese | 7.6 /100 | #231 | Tragic 13.7% |
| Immigrants | Philippines | 6.0 /100 | #232 | Tragic 13.6% |
| Immigrants | Ecuador | 5.7 /100 | #233 | Tragic 13.6% |
| Immigrants | Burma/Myanmar | 5.0 /100 | #234 | Tragic 13.5% |
| German Russians | 4.5 /100 | #235 | Tragic 13.5% |
| Immigrants | Guyana | 4.4 /100 | #236 | Tragic 13.4% |
| Jamaicans | 4.1 /100 | #237 | Tragic 13.4% |
| Hmong | 4.0 /100 | #238 | Tragic 13.4% |
| Immigrants | Nonimmigrants | 3.4 /100 | #239 | Tragic 13.3% |
| Guamanians/Chamorros | 2.2 /100 | #240 | Tragic 13.1% |
| U.S. Virgin Islanders | 2.1 /100 | #241 | Tragic 13.1% |
| Spanish Americans | 1.9 /100 | #242 | Tragic 13.0% |
| Immigrants | Jamaica | 1.9 /100 | #243 | Tragic 13.0% |
| Delaware | 1.7 /100 | #244 | Tragic 13.0% |
| Immigrants | Bahamas | 1.4 /100 | #245 | Tragic 12.9% |