Hispanic or Latino vs Immigrants from Iran Unemployment Among Ages 45 to 54 years
COMPARE
Hispanic or Latino
Immigrants from Iran
Unemployment Among Ages 45 to 54 years
Unemployment Among Ages 45 to 54 years Comparison
Hispanics or Latinos
Immigrants from Iran
5.1%
UNEMPLOYMENT AMONG AGES 45 TO 54 YEARS
0.0/ 100
METRIC RATING
283rd/ 347
METRIC RANK
4.6%
UNEMPLOYMENT AMONG AGES 45 TO 54 YEARS
11.5/ 100
METRIC RATING
212th/ 347
METRIC RANK
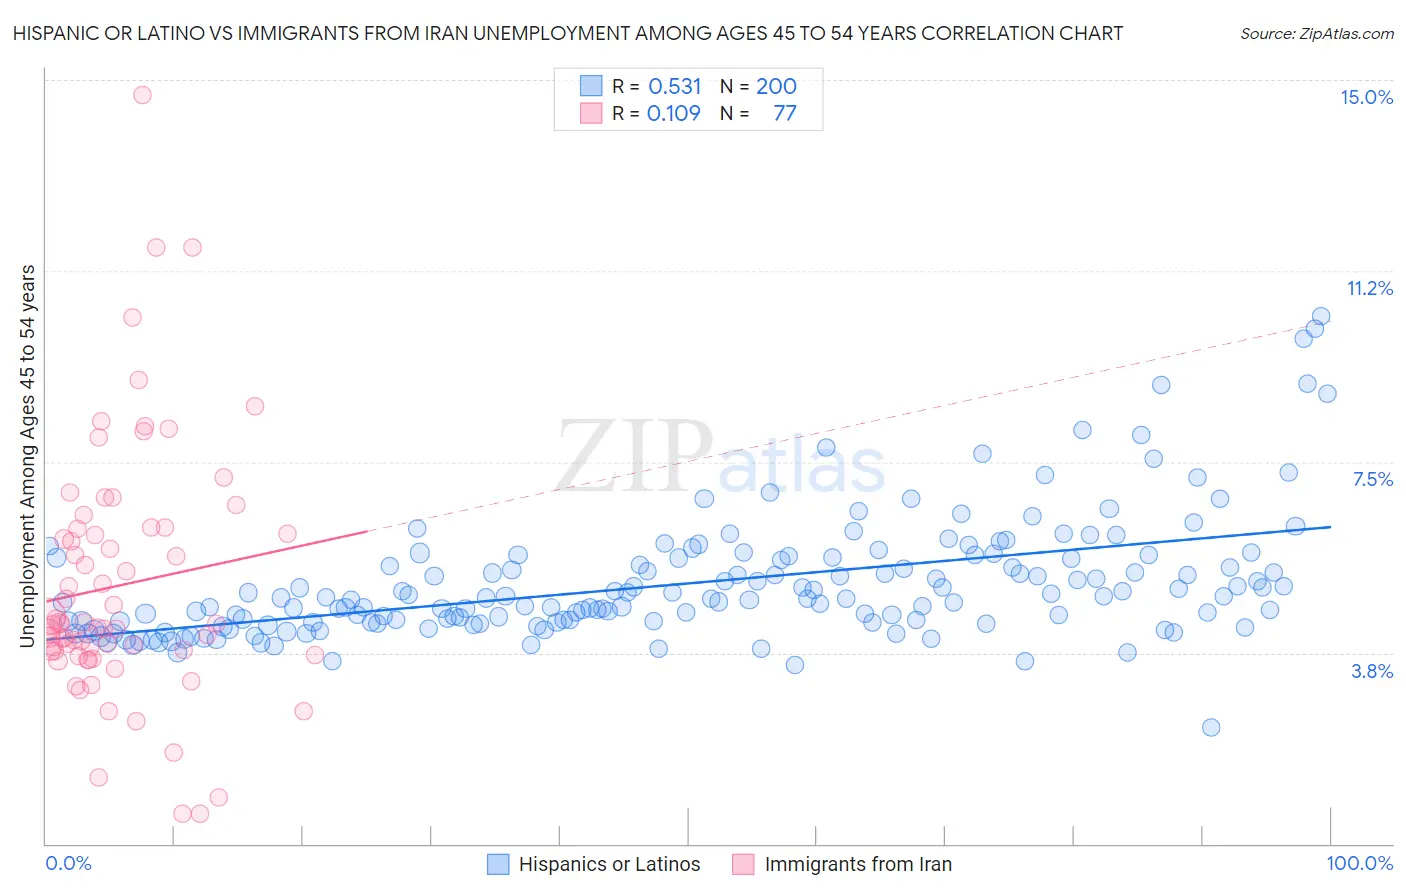
Hispanic or Latino vs Immigrants from Iran Unemployment Among Ages 45 to 54 years Correlation Chart
The statistical analysis conducted on geographies consisting of 534,115,777 people shows a substantial positive correlation between the proportion of Hispanics or Latinos and unemployment rate among population between the ages 45 and 54 in the United States with a correlation coefficient (R) of 0.531 and weighted average of 5.1%. Similarly, the statistical analysis conducted on geographies consisting of 276,106,625 people shows a poor positive correlation between the proportion of Immigrants from Iran and unemployment rate among population between the ages 45 and 54 in the United States with a correlation coefficient (R) of 0.109 and weighted average of 4.6%, a difference of 9.9%.
Unemployment Among Ages 45 to 54 years Correlation Summary
| Measurement | Hispanic or Latino | Immigrants from Iran |
| Minimum | 2.3% | 0.60% |
| Maximum | 10.4% | 14.7% |
| Range | 8.1% | 14.1% |
| Mean | 5.1% | 5.1% |
| Median | 4.8% | 4.3% |
| Interquartile 25% (IQ1) | 4.4% | 3.7% |
| Interquartile 75% (IQ3) | 5.6% | 6.2% |
| Interquartile Range (IQR) | 1.3% | 2.5% |
| Standard Deviation (Sample) | 1.2% | 2.5% |
| Standard Deviation (Population) | 1.2% | 2.5% |
Similar Demographics by Unemployment Among Ages 45 to 54 years
Demographics Similar to Hispanics or Latinos by Unemployment Among Ages 45 to 54 years
In terms of unemployment among ages 45 to 54 years, the demographic groups most similar to Hispanics or Latinos are African (5.1%, a difference of 0.41%), Spanish American Indian (5.1%, a difference of 0.56%), Blackfeet (5.1%, a difference of 0.64%), Kiowa (5.1%, a difference of 0.65%), and Iroquois (5.1%, a difference of 0.67%).
| Demographics | Rating | Rank | Unemployment Among Ages 45 to 54 years |
| French American Indians | 0.0 /100 | #276 | Tragic 5.0% |
| Immigrants | Mexico | 0.0 /100 | #277 | Tragic 5.0% |
| Dutch West Indians | 0.0 /100 | #278 | Tragic 5.0% |
| Nepalese | 0.0 /100 | #279 | Tragic 5.0% |
| Blackfeet | 0.0 /100 | #280 | Tragic 5.1% |
| Spanish American Indians | 0.0 /100 | #281 | Tragic 5.1% |
| Africans | 0.0 /100 | #282 | Tragic 5.1% |
| Hispanics or Latinos | 0.0 /100 | #283 | Tragic 5.1% |
| Kiowa | 0.0 /100 | #284 | Tragic 5.1% |
| Iroquois | 0.0 /100 | #285 | Tragic 5.1% |
| Senegalese | 0.0 /100 | #286 | Tragic 5.1% |
| Haitians | 0.0 /100 | #287 | Tragic 5.2% |
| Immigrants | Caribbean | 0.0 /100 | #288 | Tragic 5.2% |
| Immigrants | Haiti | 0.0 /100 | #289 | Tragic 5.2% |
| Immigrants | Portugal | 0.0 /100 | #290 | Tragic 5.2% |
Demographics Similar to Immigrants from Iran by Unemployment Among Ages 45 to 54 years
In terms of unemployment among ages 45 to 54 years, the demographic groups most similar to Immigrants from Iran are Creek (4.6%, a difference of 0.040%), Immigrants from South America (4.6%, a difference of 0.070%), Panamanian (4.6%, a difference of 0.090%), Cherokee (4.6%, a difference of 0.11%), and Immigrants from Panama (4.6%, a difference of 0.13%).
| Demographics | Rating | Rank | Unemployment Among Ages 45 to 54 years |
| Immigrants | Greece | 16.2 /100 | #205 | Poor 4.6% |
| Immigrants | Switzerland | 14.0 /100 | #206 | Poor 4.6% |
| Arabs | 13.7 /100 | #207 | Poor 4.6% |
| Immigrants | Africa | 13.6 /100 | #208 | Poor 4.6% |
| Immigrants | Nigeria | 13.3 /100 | #209 | Poor 4.6% |
| Immigrants | South America | 12.2 /100 | #210 | Poor 4.6% |
| Creek | 11.9 /100 | #211 | Poor 4.6% |
| Immigrants | Iran | 11.5 /100 | #212 | Poor 4.6% |
| Panamanians | 10.7 /100 | #213 | Poor 4.6% |
| Cherokee | 10.6 /100 | #214 | Poor 4.6% |
| Immigrants | Panama | 10.4 /100 | #215 | Poor 4.6% |
| Lumbee | 9.2 /100 | #216 | Tragic 4.6% |
| Immigrants | Cambodia | 7.4 /100 | #217 | Tragic 4.7% |
| Immigrants | Uganda | 7.1 /100 | #218 | Tragic 4.7% |
| Nigerians | 7.0 /100 | #219 | Tragic 4.7% |