Hispanic or Latino vs Immigrants from Argentina Master's Degree
COMPARE
Hispanic or Latino
Immigrants from Argentina
Master's Degree
Master's Degree Comparison
Hispanics or Latinos
Immigrants from Argentina
10.9%
MASTER'S DEGREE
0.0/ 100
METRIC RATING
316th/ 347
METRIC RANK
18.0%
MASTER'S DEGREE
99.8/ 100
METRIC RATING
67th/ 347
METRIC RANK
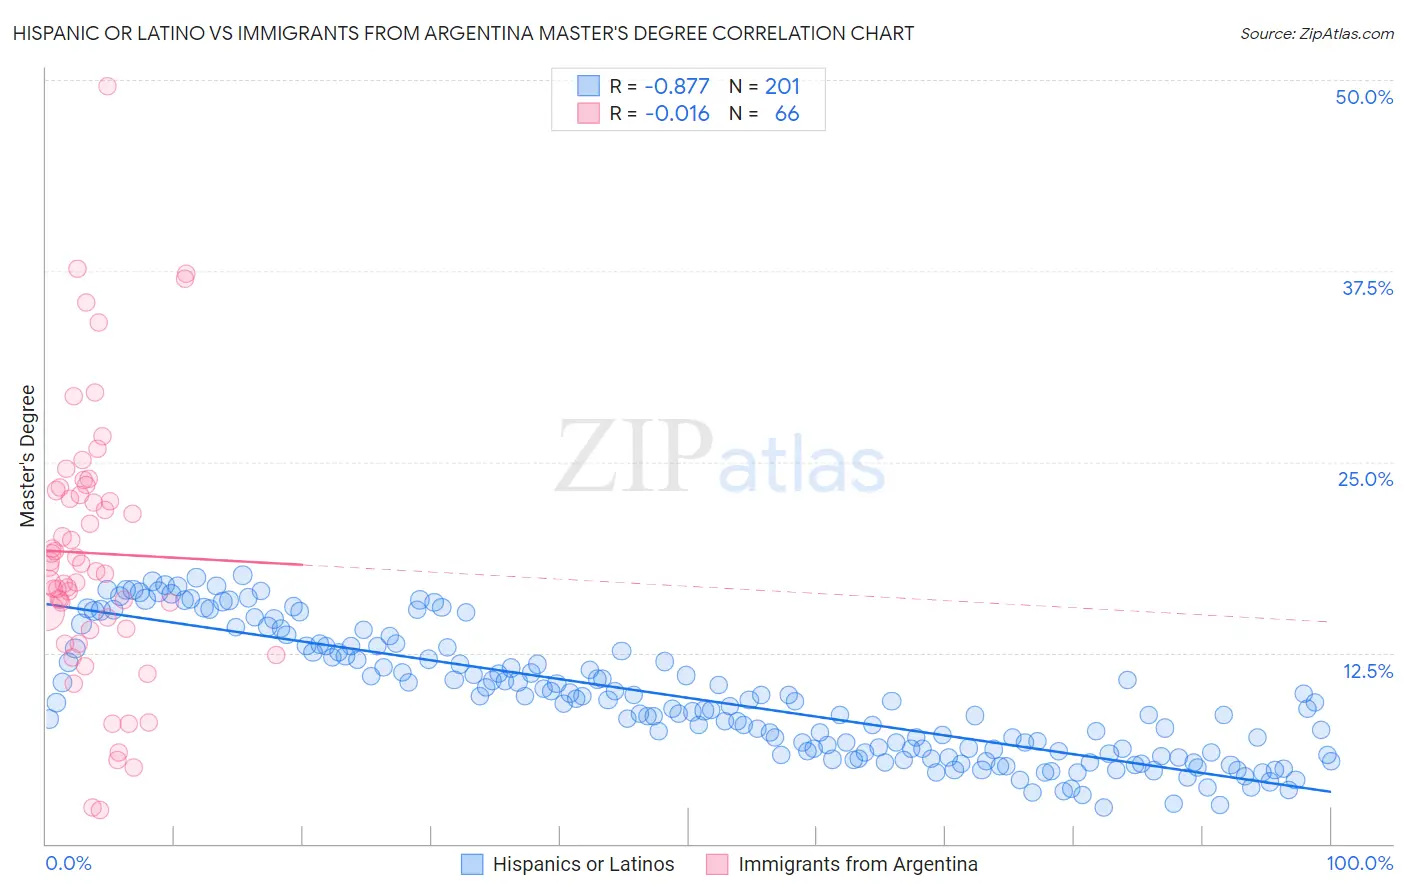
Hispanic or Latino vs Immigrants from Argentina Master's Degree Correlation Chart
The statistical analysis conducted on geographies consisting of 577,228,232 people shows a very strong negative correlation between the proportion of Hispanics or Latinos and percentage of population with at least master's degree education in the United States with a correlation coefficient (R) of -0.877 and weighted average of 10.9%. Similarly, the statistical analysis conducted on geographies consisting of 264,373,397 people shows no correlation between the proportion of Immigrants from Argentina and percentage of population with at least master's degree education in the United States with a correlation coefficient (R) of -0.016 and weighted average of 18.0%, a difference of 64.3%.
Master's Degree Correlation Summary
| Measurement | Hispanic or Latino | Immigrants from Argentina |
| Minimum | 2.4% | 2.2% |
| Maximum | 17.6% | 49.6% |
| Range | 15.2% | 47.3% |
| Mean | 9.5% | 19.0% |
| Median | 9.2% | 18.0% |
| Interquartile 25% (IQ1) | 5.9% | 14.1% |
| Interquartile 75% (IQ3) | 12.7% | 23.1% |
| Interquartile Range (IQR) | 6.8% | 9.0% |
| Standard Deviation (Sample) | 4.1% | 8.8% |
| Standard Deviation (Population) | 4.1% | 8.7% |
Similar Demographics by Master's Degree
Demographics Similar to Hispanics or Latinos by Master's Degree
In terms of master's degree, the demographic groups most similar to Hispanics or Latinos are Apache (11.0%, a difference of 0.34%), Cajun (11.0%, a difference of 0.35%), Hopi (10.9%, a difference of 0.54%), Immigrants from Cuba (10.9%, a difference of 0.67%), and Yaqui (11.0%, a difference of 0.74%).
| Demographics | Rating | Rank | Master's Degree |
| Puget Sound Salish | 0.0 /100 | #309 | Tragic 11.1% |
| Shoshone | 0.0 /100 | #310 | Tragic 11.1% |
| Seminole | 0.0 /100 | #311 | Tragic 11.0% |
| Choctaw | 0.0 /100 | #312 | Tragic 11.0% |
| Yaqui | 0.0 /100 | #313 | Tragic 11.0% |
| Cajuns | 0.0 /100 | #314 | Tragic 11.0% |
| Apache | 0.0 /100 | #315 | Tragic 11.0% |
| Hispanics or Latinos | 0.0 /100 | #316 | Tragic 10.9% |
| Hopi | 0.0 /100 | #317 | Tragic 10.9% |
| Immigrants | Cuba | 0.0 /100 | #318 | Tragic 10.9% |
| Kiowa | 0.0 /100 | #319 | Tragic 10.8% |
| Immigrants | Micronesia | 0.0 /100 | #320 | Tragic 10.8% |
| Pennsylvania Germans | 0.0 /100 | #321 | Tragic 10.7% |
| Sioux | 0.0 /100 | #322 | Tragic 10.7% |
| Crow | 0.0 /100 | #323 | Tragic 10.6% |
Demographics Similar to Immigrants from Argentina by Master's Degree
In terms of master's degree, the demographic groups most similar to Immigrants from Argentina are Ethiopian (18.0%, a difference of 0.050%), Immigrants from Kazakhstan (18.0%, a difference of 0.070%), Immigrants from Ethiopia (17.9%, a difference of 0.23%), Immigrants from Uzbekistan (17.9%, a difference of 0.55%), and Immigrants from Western Europe (17.8%, a difference of 0.77%).
| Demographics | Rating | Rank | Master's Degree |
| New Zealanders | 99.9 /100 | #60 | Exceptional 18.3% |
| Immigrants | Europe | 99.9 /100 | #61 | Exceptional 18.2% |
| Argentineans | 99.9 /100 | #62 | Exceptional 18.2% |
| Immigrants | Netherlands | 99.9 /100 | #63 | Exceptional 18.1% |
| South Africans | 99.9 /100 | #64 | Exceptional 18.1% |
| Immigrants | Kazakhstan | 99.8 /100 | #65 | Exceptional 18.0% |
| Ethiopians | 99.8 /100 | #66 | Exceptional 18.0% |
| Immigrants | Argentina | 99.8 /100 | #67 | Exceptional 18.0% |
| Immigrants | Ethiopia | 99.8 /100 | #68 | Exceptional 17.9% |
| Immigrants | Uzbekistan | 99.8 /100 | #69 | Exceptional 17.9% |
| Immigrants | Western Europe | 99.8 /100 | #70 | Exceptional 17.8% |
| Immigrants | Pakistan | 99.7 /100 | #71 | Exceptional 17.8% |
| Lithuanians | 99.7 /100 | #72 | Exceptional 17.7% |
| Zimbabweans | 99.7 /100 | #73 | Exceptional 17.7% |
| Immigrants | Romania | 99.7 /100 | #74 | Exceptional 17.7% |