Hawaiian vs Immigrants from Thailand College, Under 1 year
COMPARE
Hawaiian
Immigrants from Thailand
College, Under 1 year
College, Under 1 year Comparison
Hawaiians
Immigrants from Thailand
62.1%
COLLEGE, UNDER 1 YEAR
1.1/ 100
METRIC RATING
243rd/ 347
METRIC RANK
64.7%
COLLEGE, UNDER 1 YEAR
27.0/ 100
METRIC RATING
192nd/ 347
METRIC RANK
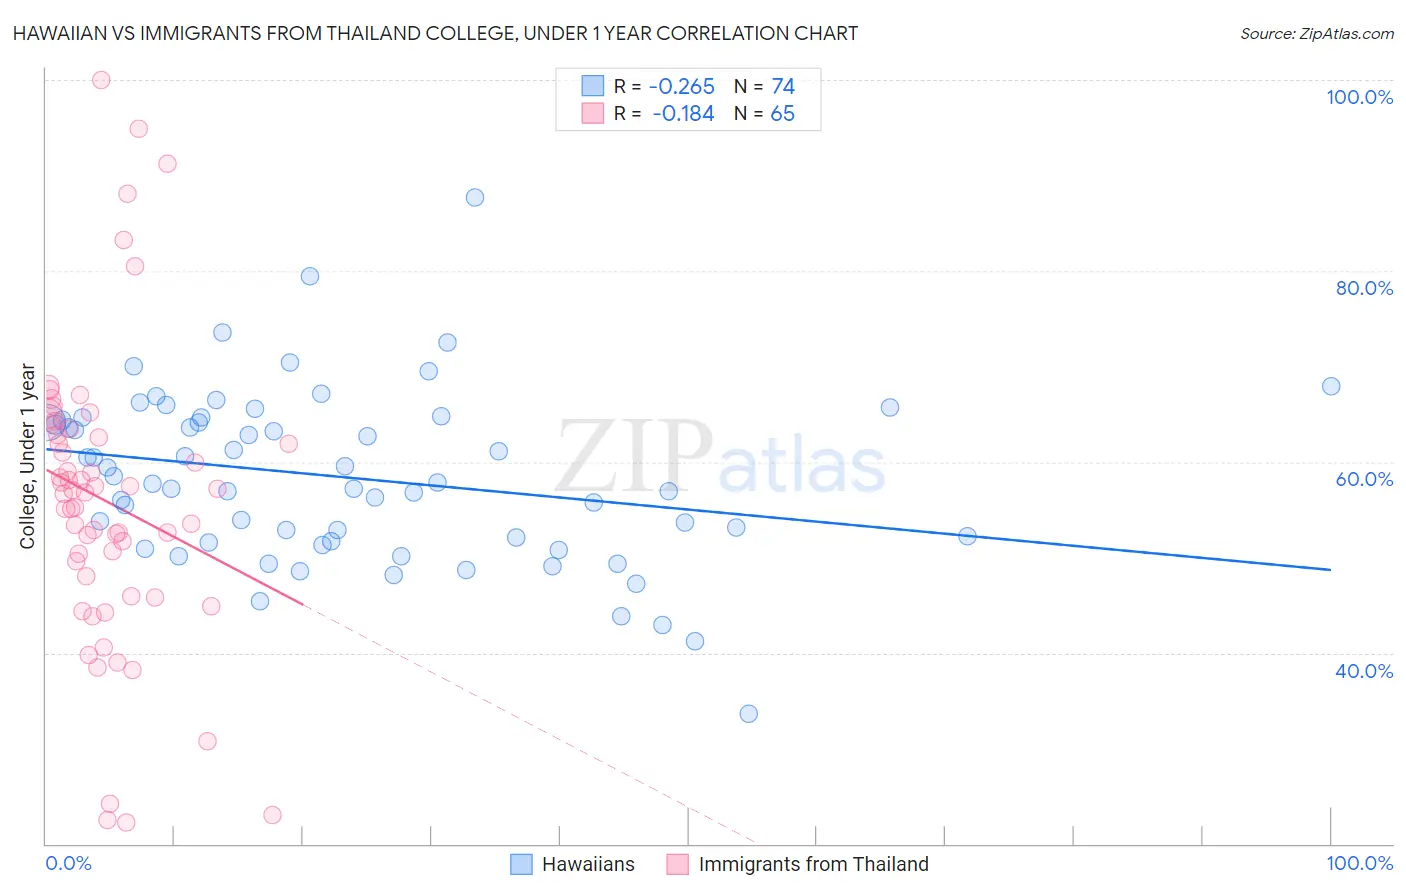
Hawaiian vs Immigrants from Thailand College, Under 1 year Correlation Chart
The statistical analysis conducted on geographies consisting of 327,620,447 people shows a weak negative correlation between the proportion of Hawaiians and percentage of population with at least college, under 1 year education in the United States with a correlation coefficient (R) of -0.265 and weighted average of 62.1%. Similarly, the statistical analysis conducted on geographies consisting of 317,023,903 people shows a poor negative correlation between the proportion of Immigrants from Thailand and percentage of population with at least college, under 1 year education in the United States with a correlation coefficient (R) of -0.184 and weighted average of 64.7%, a difference of 4.1%.
College, Under 1 year Correlation Summary
| Measurement | Hawaiian | Immigrants from Thailand |
| Minimum | 33.7% | 22.2% |
| Maximum | 87.7% | 100.0% |
| Range | 54.1% | 77.8% |
| Mean | 58.4% | 55.9% |
| Median | 57.8% | 56.8% |
| Interquartile 25% (IQ1) | 51.7% | 47.0% |
| Interquartile 75% (IQ3) | 64.3% | 63.1% |
| Interquartile Range (IQR) | 12.6% | 16.2% |
| Standard Deviation (Sample) | 9.0% | 15.7% |
| Standard Deviation (Population) | 9.0% | 15.5% |
Similar Demographics by College, Under 1 year
Demographics Similar to Hawaiians by College, Under 1 year
In terms of college, under 1 year, the demographic groups most similar to Hawaiians are Malaysian (62.2%, a difference of 0.030%), Ottawa (62.2%, a difference of 0.080%), Nepalese (62.2%, a difference of 0.090%), Aleut (62.2%, a difference of 0.090%), and Colville (62.1%, a difference of 0.090%).
| Demographics | Rating | Rank | College, Under 1 year |
| Immigrants | Immigrants | 1.7 /100 | #236 | Tragic 62.5% |
| Immigrants | Burma/Myanmar | 1.6 /100 | #237 | Tragic 62.5% |
| French American Indians | 1.5 /100 | #238 | Tragic 62.4% |
| Nepalese | 1.1 /100 | #239 | Tragic 62.2% |
| Aleuts | 1.1 /100 | #240 | Tragic 62.2% |
| Ottawa | 1.1 /100 | #241 | Tragic 62.2% |
| Malaysians | 1.1 /100 | #242 | Tragic 62.2% |
| Hawaiians | 1.1 /100 | #243 | Tragic 62.1% |
| Colville | 1.0 /100 | #244 | Tragic 62.1% |
| Delaware | 0.9 /100 | #245 | Tragic 62.1% |
| Marshallese | 0.8 /100 | #246 | Tragic 61.9% |
| Immigrants | Liberia | 0.8 /100 | #247 | Tragic 61.9% |
| Potawatomi | 0.6 /100 | #248 | Tragic 61.8% |
| Vietnamese | 0.5 /100 | #249 | Tragic 61.7% |
| Immigrants | Congo | 0.5 /100 | #250 | Tragic 61.7% |
Demographics Similar to Immigrants from Thailand by College, Under 1 year
In terms of college, under 1 year, the demographic groups most similar to Immigrants from Thailand are Slovak (64.7%, a difference of 0.020%), Immigrants from Armenia (64.7%, a difference of 0.060%), Immigrants from Cameroon (64.6%, a difference of 0.14%), Immigrants from Philippines (64.8%, a difference of 0.17%), and Spanish (64.9%, a difference of 0.24%).
| Demographics | Rating | Rank | College, Under 1 year |
| Sri Lankans | 41.7 /100 | #185 | Average 65.2% |
| Immigrants | Sierra Leone | 39.7 /100 | #186 | Fair 65.1% |
| Immigrants | Southern Europe | 34.3 /100 | #187 | Fair 64.9% |
| Immigrants | Albania | 32.0 /100 | #188 | Fair 64.9% |
| Spanish | 31.6 /100 | #189 | Fair 64.9% |
| Immigrants | Philippines | 30.1 /100 | #190 | Fair 64.8% |
| Immigrants | Armenia | 28.1 /100 | #191 | Fair 64.7% |
| Immigrants | Thailand | 27.0 /100 | #192 | Fair 64.7% |
| Slovaks | 26.7 /100 | #193 | Fair 64.7% |
| Immigrants | Cameroon | 24.6 /100 | #194 | Fair 64.6% |
| Immigrants | South Eastern Asia | 22.1 /100 | #195 | Fair 64.5% |
| Tongans | 21.2 /100 | #196 | Fair 64.5% |
| Costa Ricans | 19.6 /100 | #197 | Poor 64.4% |
| Tsimshian | 17.9 /100 | #198 | Poor 64.3% |
| Panamanians | 17.0 /100 | #199 | Poor 64.3% |