Hawaiian vs Immigrants from Barbados College, Under 1 year
COMPARE
Hawaiian
Immigrants from Barbados
College, Under 1 year
College, Under 1 year Comparison
Hawaiians
Immigrants from Barbados
62.1%
COLLEGE, UNDER 1 YEAR
1.1/ 100
METRIC RATING
243rd/ 347
METRIC RANK
60.4%
COLLEGE, UNDER 1 YEAR
0.1/ 100
METRIC RATING
275th/ 347
METRIC RANK
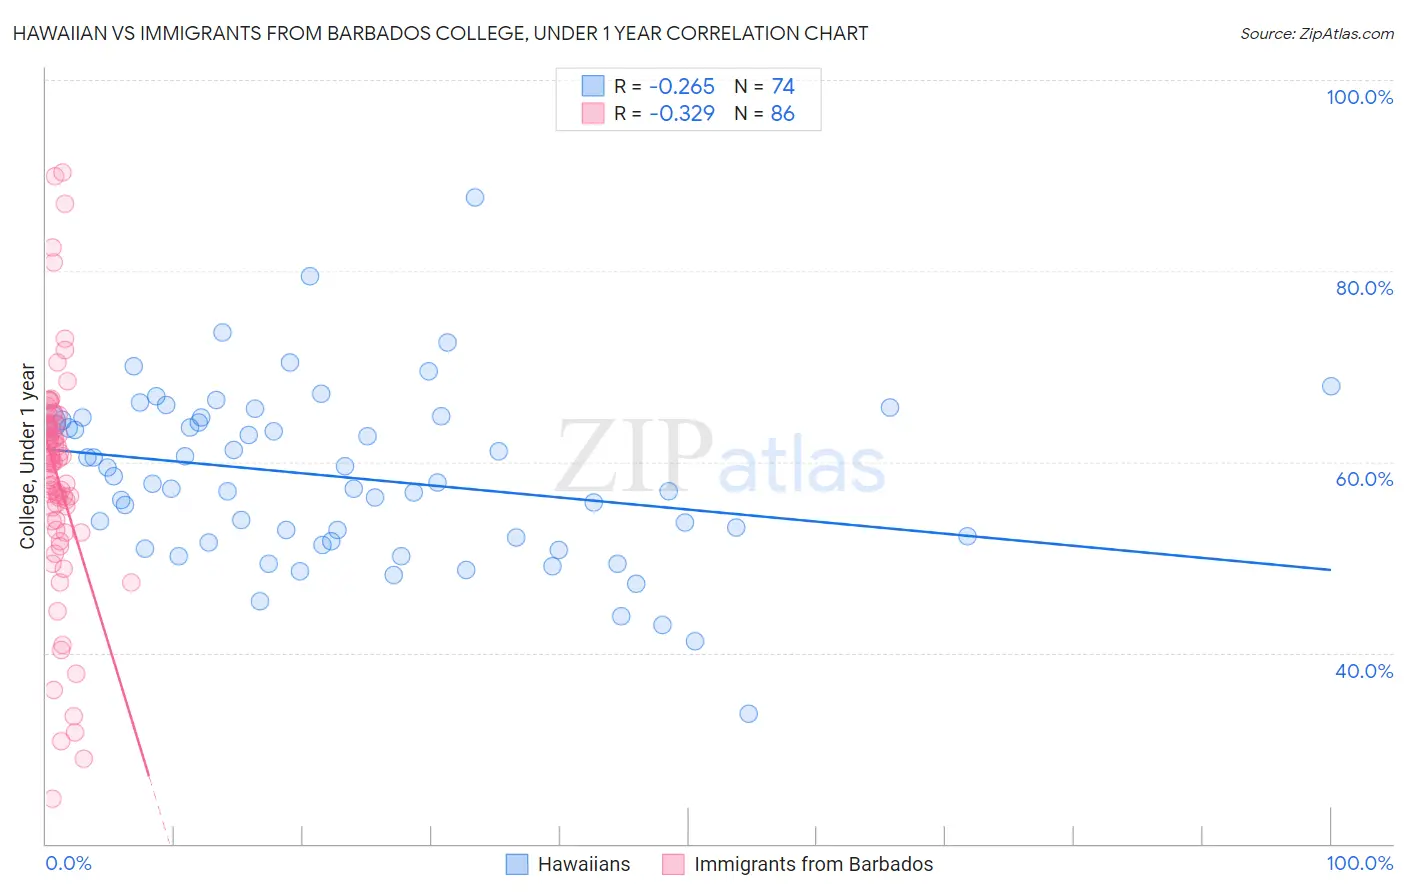
Hawaiian vs Immigrants from Barbados College, Under 1 year Correlation Chart
The statistical analysis conducted on geographies consisting of 327,620,447 people shows a weak negative correlation between the proportion of Hawaiians and percentage of population with at least college, under 1 year education in the United States with a correlation coefficient (R) of -0.265 and weighted average of 62.1%. Similarly, the statistical analysis conducted on geographies consisting of 112,783,541 people shows a mild negative correlation between the proportion of Immigrants from Barbados and percentage of population with at least college, under 1 year education in the United States with a correlation coefficient (R) of -0.329 and weighted average of 60.4%, a difference of 3.0%.
College, Under 1 year Correlation Summary
| Measurement | Hawaiian | Immigrants from Barbados |
| Minimum | 33.7% | 24.7% |
| Maximum | 87.7% | 90.3% |
| Range | 54.1% | 65.6% |
| Mean | 58.4% | 58.4% |
| Median | 57.8% | 60.0% |
| Interquartile 25% (IQ1) | 51.7% | 53.9% |
| Interquartile 75% (IQ3) | 64.3% | 63.9% |
| Interquartile Range (IQR) | 12.6% | 10.0% |
| Standard Deviation (Sample) | 9.0% | 11.9% |
| Standard Deviation (Population) | 9.0% | 11.9% |
Similar Demographics by College, Under 1 year
Demographics Similar to Hawaiians by College, Under 1 year
In terms of college, under 1 year, the demographic groups most similar to Hawaiians are Malaysian (62.2%, a difference of 0.030%), Ottawa (62.2%, a difference of 0.080%), Nepalese (62.2%, a difference of 0.090%), Aleut (62.2%, a difference of 0.090%), and Colville (62.1%, a difference of 0.090%).
| Demographics | Rating | Rank | College, Under 1 year |
| Immigrants | Immigrants | 1.7 /100 | #236 | Tragic 62.5% |
| Immigrants | Burma/Myanmar | 1.6 /100 | #237 | Tragic 62.5% |
| French American Indians | 1.5 /100 | #238 | Tragic 62.4% |
| Nepalese | 1.1 /100 | #239 | Tragic 62.2% |
| Aleuts | 1.1 /100 | #240 | Tragic 62.2% |
| Ottawa | 1.1 /100 | #241 | Tragic 62.2% |
| Malaysians | 1.1 /100 | #242 | Tragic 62.2% |
| Hawaiians | 1.1 /100 | #243 | Tragic 62.1% |
| Colville | 1.0 /100 | #244 | Tragic 62.1% |
| Delaware | 0.9 /100 | #245 | Tragic 62.1% |
| Marshallese | 0.8 /100 | #246 | Tragic 61.9% |
| Immigrants | Liberia | 0.8 /100 | #247 | Tragic 61.9% |
| Potawatomi | 0.6 /100 | #248 | Tragic 61.8% |
| Vietnamese | 0.5 /100 | #249 | Tragic 61.7% |
| Immigrants | Congo | 0.5 /100 | #250 | Tragic 61.7% |
Demographics Similar to Immigrants from Barbados by College, Under 1 year
In terms of college, under 1 year, the demographic groups most similar to Immigrants from Barbados are Arapaho (60.3%, a difference of 0.030%), Chickasaw (60.4%, a difference of 0.13%), Alaska Native (60.4%, a difference of 0.13%), Bahamian (60.3%, a difference of 0.17%), and Jamaican (60.5%, a difference of 0.18%).
| Demographics | Rating | Rank | College, Under 1 year |
| Immigrants | Trinidad and Tobago | 0.1 /100 | #268 | Tragic 60.7% |
| Immigrants | West Indies | 0.1 /100 | #269 | Tragic 60.6% |
| Cheyenne | 0.1 /100 | #270 | Tragic 60.6% |
| U.S. Virgin Islanders | 0.1 /100 | #271 | Tragic 60.6% |
| Jamaicans | 0.1 /100 | #272 | Tragic 60.5% |
| Chickasaw | 0.1 /100 | #273 | Tragic 60.4% |
| Alaska Natives | 0.1 /100 | #274 | Tragic 60.4% |
| Immigrants | Barbados | 0.1 /100 | #275 | Tragic 60.4% |
| Arapaho | 0.1 /100 | #276 | Tragic 60.3% |
| Bahamians | 0.1 /100 | #277 | Tragic 60.3% |
| Yaqui | 0.1 /100 | #278 | Tragic 60.2% |
| Ute | 0.1 /100 | #279 | Tragic 60.2% |
| Crow | 0.1 /100 | #280 | Tragic 60.2% |
| Cherokee | 0.1 /100 | #281 | Tragic 60.1% |
| Belizeans | 0.1 /100 | #282 | Tragic 60.1% |