Hawaiian vs Immigrants from Mexico Male Unemployment
COMPARE
Hawaiian
Immigrants from Mexico
Male Unemployment
Male Unemployment Comparison
Hawaiians
Immigrants from Mexico
5.7%
MALE UNEMPLOYMENT
0.6/ 100
METRIC RATING
247th/ 347
METRIC RANK
5.9%
MALE UNEMPLOYMENT
0.0/ 100
METRIC RATING
264th/ 347
METRIC RANK
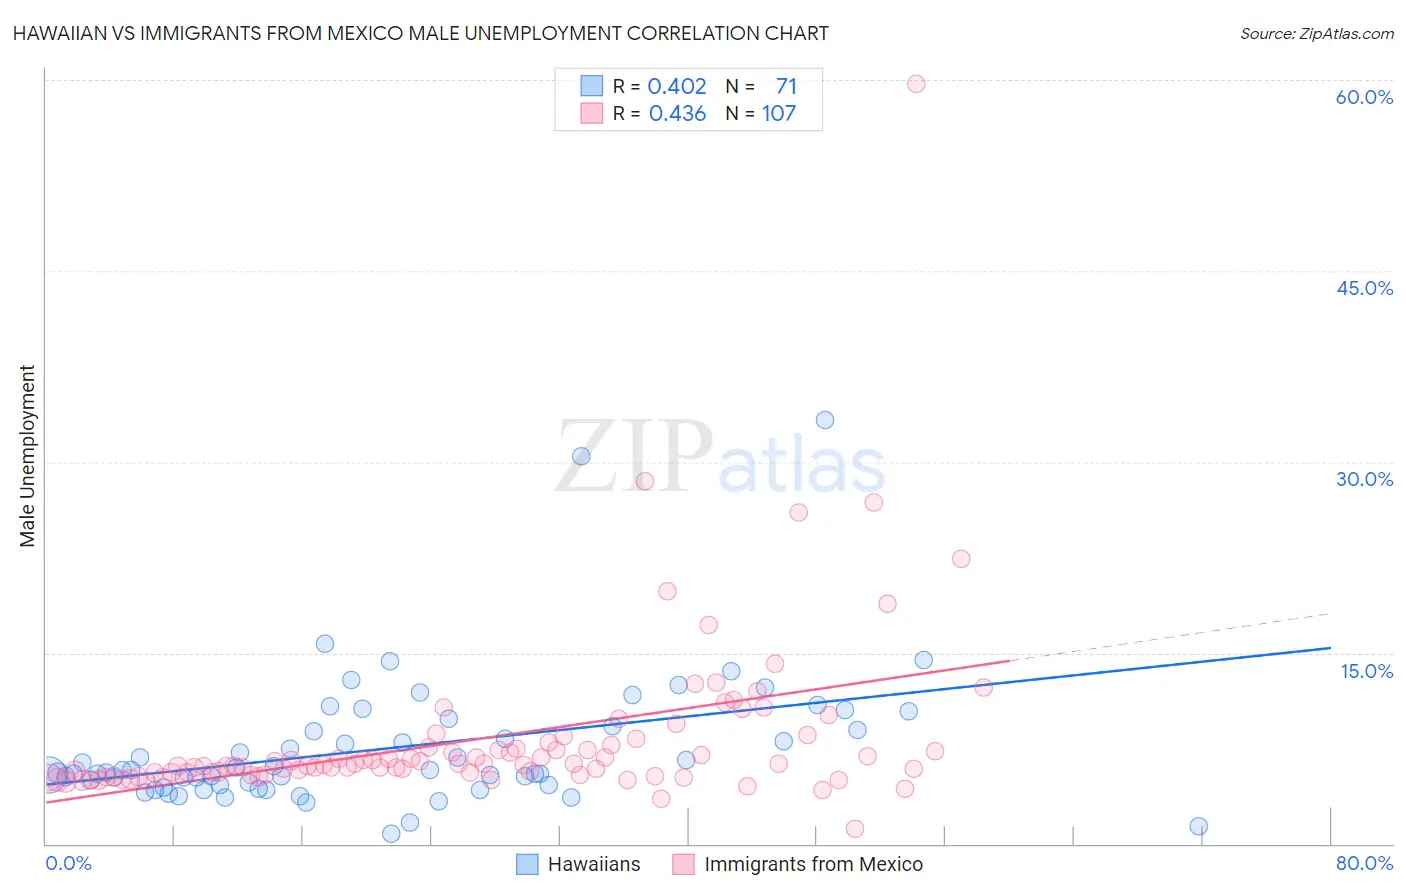
Hawaiian vs Immigrants from Mexico Male Unemployment Correlation Chart
The statistical analysis conducted on geographies consisting of 326,392,537 people shows a moderate positive correlation between the proportion of Hawaiians and unemployment rate among males in the United States with a correlation coefficient (R) of 0.402 and weighted average of 5.7%. Similarly, the statistical analysis conducted on geographies consisting of 508,075,361 people shows a moderate positive correlation between the proportion of Immigrants from Mexico and unemployment rate among males in the United States with a correlation coefficient (R) of 0.436 and weighted average of 5.9%, a difference of 3.4%.
Male Unemployment Correlation Summary
| Measurement | Hawaiian | Immigrants from Mexico |
| Minimum | 0.80% | 1.2% |
| Maximum | 33.3% | 59.7% |
| Range | 32.5% | 58.5% |
| Mean | 7.5% | 8.3% |
| Median | 5.6% | 6.2% |
| Interquartile 25% (IQ1) | 4.6% | 5.4% |
| Interquartile 75% (IQ3) | 9.2% | 7.8% |
| Interquartile Range (IQR) | 4.6% | 2.4% |
| Standard Deviation (Sample) | 5.3% | 6.8% |
| Standard Deviation (Population) | 5.3% | 6.8% |
Demographics Similar to Hawaiians and Immigrants from Mexico by Male Unemployment
In terms of male unemployment, the demographic groups most similar to Hawaiians are Iroquois (5.7%, a difference of 0.10%), Yaqui (5.7%, a difference of 0.19%), Marshallese (5.7%, a difference of 0.32%), Cree (5.7%, a difference of 0.39%), and Immigrants from Bahamas (5.7%, a difference of 0.63%). Similarly, the demographic groups most similar to Immigrants from Mexico are Immigrants from Latin America (5.9%, a difference of 0.22%), French American Indian (5.9%, a difference of 0.39%), Immigrants from Portugal (5.9%, a difference of 0.46%), Liberian (5.8%, a difference of 0.92%), and Immigrants from Central America (5.8%, a difference of 1.1%).
| Demographics | Rating | Rank | Male Unemployment |
| Yaqui | 0.7 /100 | #245 | Tragic 5.7% |
| Iroquois | 0.6 /100 | #246 | Tragic 5.7% |
| Hawaiians | 0.6 /100 | #247 | Tragic 5.7% |
| Marshallese | 0.5 /100 | #248 | Tragic 5.7% |
| Cree | 0.4 /100 | #249 | Tragic 5.7% |
| Immigrants | Bahamas | 0.4 /100 | #250 | Tragic 5.7% |
| Spanish Americans | 0.3 /100 | #251 | Tragic 5.7% |
| Mexicans | 0.2 /100 | #252 | Tragic 5.8% |
| Mexican American Indians | 0.2 /100 | #253 | Tragic 5.8% |
| Japanese | 0.2 /100 | #254 | Tragic 5.8% |
| Kiowa | 0.2 /100 | #255 | Tragic 5.8% |
| Comanche | 0.2 /100 | #256 | Tragic 5.8% |
| Hispanics or Latinos | 0.1 /100 | #257 | Tragic 5.8% |
| Dutch West Indians | 0.1 /100 | #258 | Tragic 5.8% |
| Cajuns | 0.1 /100 | #259 | Tragic 5.8% |
| Immigrants | Central America | 0.1 /100 | #260 | Tragic 5.8% |
| Liberians | 0.1 /100 | #261 | Tragic 5.8% |
| Immigrants | Portugal | 0.1 /100 | #262 | Tragic 5.9% |
| Immigrants | Latin America | 0.1 /100 | #263 | Tragic 5.9% |
| Immigrants | Mexico | 0.0 /100 | #264 | Tragic 5.9% |
| French American Indians | 0.0 /100 | #265 | Tragic 5.9% |