Hawaiian vs Immigrants from Mexico No Vehicles in Household
COMPARE
Hawaiian
Immigrants from Mexico
No Vehicles in Household
No Vehicles in Household Comparison
Hawaiians
Immigrants from Mexico
8.0%
NO VEHICLES IN HOUSEHOLD
99.9/ 100
METRIC RATING
52nd/ 347
METRIC RANK
8.1%
NO VEHICLES IN HOUSEHOLD
99.8/ 100
METRIC RATING
58th/ 347
METRIC RANK
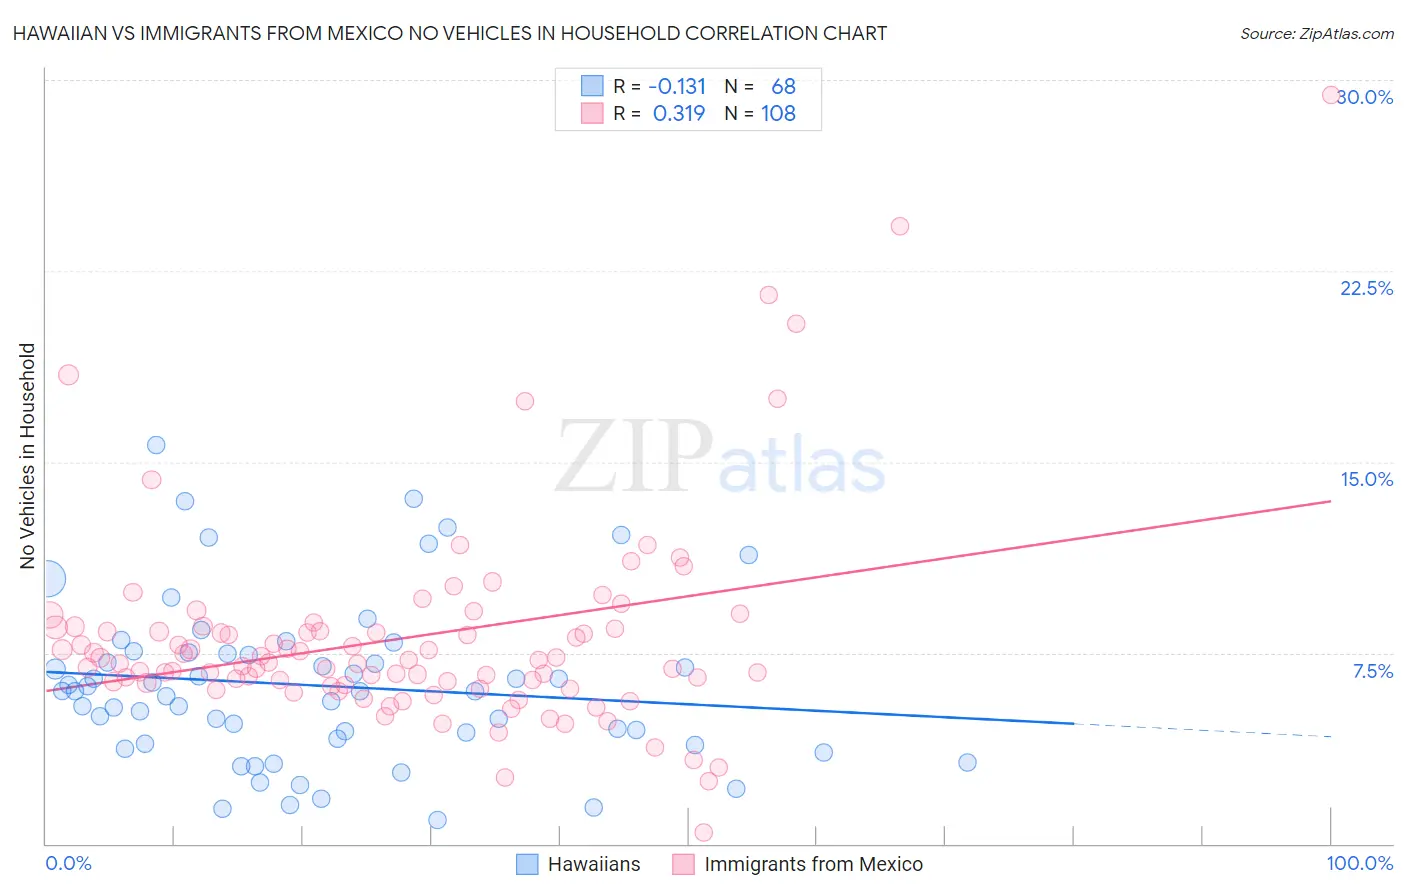
Hawaiian vs Immigrants from Mexico No Vehicles in Household Correlation Chart
The statistical analysis conducted on geographies consisting of 326,809,450 people shows a poor negative correlation between the proportion of Hawaiians and percentage of households with no vehicle available in the United States with a correlation coefficient (R) of -0.131 and weighted average of 8.0%. Similarly, the statistical analysis conducted on geographies consisting of 510,868,339 people shows a mild positive correlation between the proportion of Immigrants from Mexico and percentage of households with no vehicle available in the United States with a correlation coefficient (R) of 0.319 and weighted average of 8.1%, a difference of 1.2%.
No Vehicles in Household Correlation Summary
| Measurement | Hawaiian | Immigrants from Mexico |
| Minimum | 0.92% | 0.44% |
| Maximum | 15.7% | 29.4% |
| Range | 14.7% | 29.0% |
| Mean | 6.2% | 8.1% |
| Median | 6.0% | 7.2% |
| Interquartile 25% (IQ1) | 4.0% | 6.3% |
| Interquartile 75% (IQ3) | 7.5% | 8.5% |
| Interquartile Range (IQR) | 3.5% | 2.2% |
| Standard Deviation (Sample) | 3.2% | 4.1% |
| Standard Deviation (Population) | 3.2% | 4.1% |
Demographics Similar to Hawaiians and Immigrants from Mexico by No Vehicles in Household
In terms of no vehicles in household, the demographic groups most similar to Hawaiians are Slovene (8.0%, a difference of 0.0%), Immigrants from Venezuela (8.1%, a difference of 0.31%), Celtic (8.1%, a difference of 0.40%), Korean (8.0%, a difference of 0.58%), and Belgian (8.0%, a difference of 0.68%). Similarly, the demographic groups most similar to Immigrants from Mexico are Venezuelan (8.1%, a difference of 0.11%), Immigrants from India (8.2%, a difference of 0.35%), Immigrants from Afghanistan (8.1%, a difference of 0.39%), Immigrants from Laos (8.2%, a difference of 0.42%), and Thai (8.2%, a difference of 0.59%).
| Demographics | Rating | Rank | No Vehicles in Household |
| Immigrants | Nonimmigrants | 99.9 /100 | #45 | Exceptional 7.9% |
| Spanish | 99.9 /100 | #46 | Exceptional 7.9% |
| Northern Europeans | 99.9 /100 | #47 | Exceptional 7.9% |
| Afghans | 99.9 /100 | #48 | Exceptional 8.0% |
| Guamanians/Chamorros | 99.9 /100 | #49 | Exceptional 8.0% |
| Belgians | 99.9 /100 | #50 | Exceptional 8.0% |
| Koreans | 99.9 /100 | #51 | Exceptional 8.0% |
| Hawaiians | 99.9 /100 | #52 | Exceptional 8.0% |
| Slovenes | 99.9 /100 | #53 | Exceptional 8.0% |
| Immigrants | Venezuela | 99.9 /100 | #54 | Exceptional 8.1% |
| Celtics | 99.9 /100 | #55 | Exceptional 8.1% |
| Immigrants | Afghanistan | 99.9 /100 | #56 | Exceptional 8.1% |
| Venezuelans | 99.8 /100 | #57 | Exceptional 8.1% |
| Immigrants | Mexico | 99.8 /100 | #58 | Exceptional 8.1% |
| Immigrants | India | 99.8 /100 | #59 | Exceptional 8.2% |
| Immigrants | Laos | 99.8 /100 | #60 | Exceptional 8.2% |
| Thais | 99.8 /100 | #61 | Exceptional 8.2% |
| Chinese | 99.8 /100 | #62 | Exceptional 8.2% |
| Slovaks | 99.8 /100 | #63 | Exceptional 8.3% |
| Croatians | 99.8 /100 | #64 | Exceptional 8.3% |
| Canadians | 99.7 /100 | #65 | Exceptional 8.3% |