Hawaiian vs Immigrants from Czechoslovakia College, 1 year or more
COMPARE
Hawaiian
Immigrants from Czechoslovakia
College, 1 year or more
College, 1 year or more Comparison
Hawaiians
Immigrants from Czechoslovakia
55.6%
COLLEGE, 1 YEAR OR MORE
0.8/ 100
METRIC RATING
247th/ 347
METRIC RANK
64.1%
COLLEGE, 1 YEAR OR MORE
99.7/ 100
METRIC RATING
56th/ 347
METRIC RANK
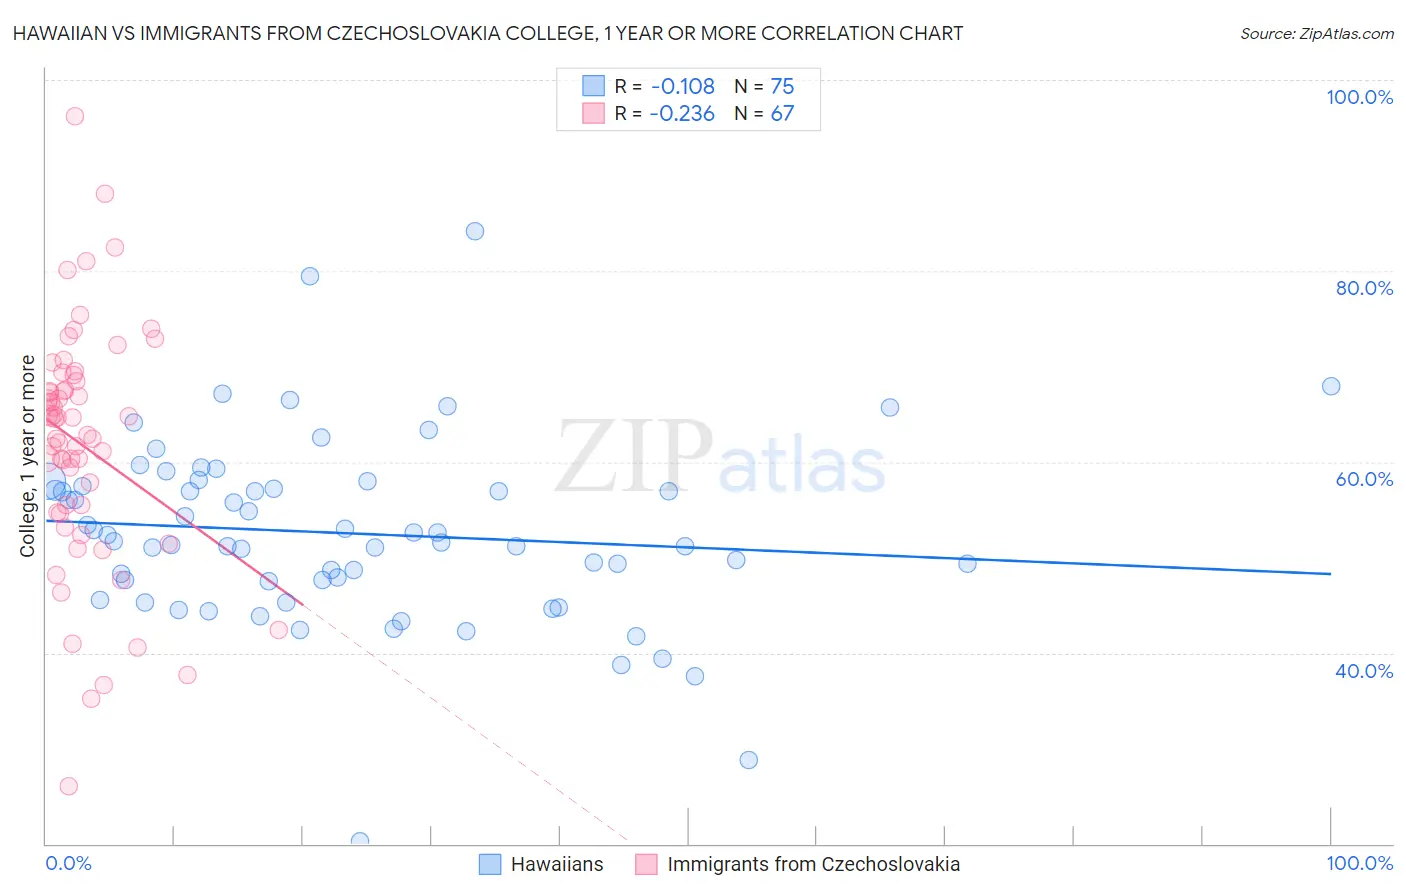
Hawaiian vs Immigrants from Czechoslovakia College, 1 year or more Correlation Chart
The statistical analysis conducted on geographies consisting of 327,619,549 people shows a poor negative correlation between the proportion of Hawaiians and percentage of population with at least college, 1 year or more education in the United States with a correlation coefficient (R) of -0.108 and weighted average of 55.6%. Similarly, the statistical analysis conducted on geographies consisting of 195,448,477 people shows a weak negative correlation between the proportion of Immigrants from Czechoslovakia and percentage of population with at least college, 1 year or more education in the United States with a correlation coefficient (R) of -0.236 and weighted average of 64.1%, a difference of 15.3%.
College, 1 year or more Correlation Summary
| Measurement | Hawaiian | Immigrants from Czechoslovakia |
| Minimum | 20.3% | 26.0% |
| Maximum | 84.1% | 96.2% |
| Range | 63.8% | 70.3% |
| Mean | 52.5% | 61.8% |
| Median | 51.7% | 64.5% |
| Interquartile 25% (IQ1) | 47.5% | 54.6% |
| Interquartile 75% (IQ3) | 57.4% | 68.5% |
| Interquartile Range (IQR) | 9.9% | 13.8% |
| Standard Deviation (Sample) | 9.7% | 12.5% |
| Standard Deviation (Population) | 9.7% | 12.4% |
Similar Demographics by College, 1 year or more
Demographics Similar to Hawaiians by College, 1 year or more
In terms of college, 1 year or more, the demographic groups most similar to Hawaiians are Immigrants from Congo (55.6%, a difference of 0.040%), Malaysian (55.6%, a difference of 0.070%), Immigrants from Liberia (55.7%, a difference of 0.12%), Immigrants from Trinidad and Tobago (55.5%, a difference of 0.13%), and Delaware (55.5%, a difference of 0.16%).
| Demographics | Rating | Rank | College, 1 year or more |
| Trinidadians and Tobagonians | 1.1 /100 | #240 | Tragic 55.8% |
| French American Indians | 1.0 /100 | #241 | Tragic 55.8% |
| Marshallese | 1.0 /100 | #242 | Tragic 55.8% |
| Osage | 1.0 /100 | #243 | Tragic 55.8% |
| Chippewa | 0.9 /100 | #244 | Tragic 55.7% |
| Immigrants | Liberia | 0.8 /100 | #245 | Tragic 55.7% |
| Malaysians | 0.8 /100 | #246 | Tragic 55.6% |
| Hawaiians | 0.8 /100 | #247 | Tragic 55.6% |
| Immigrants | Congo | 0.8 /100 | #248 | Tragic 55.6% |
| Immigrants | Trinidad and Tobago | 0.7 /100 | #249 | Tragic 55.5% |
| Delaware | 0.7 /100 | #250 | Tragic 55.5% |
| Immigrants | Cambodia | 0.6 /100 | #251 | Tragic 55.4% |
| Aleuts | 0.6 /100 | #252 | Tragic 55.4% |
| Immigrants | Barbados | 0.6 /100 | #253 | Tragic 55.4% |
| Japanese | 0.5 /100 | #254 | Tragic 55.2% |
Demographics Similar to Immigrants from Czechoslovakia by College, 1 year or more
In terms of college, 1 year or more, the demographic groups most similar to Immigrants from Czechoslovakia are South African (64.1%, a difference of 0.010%), Immigrants from Belarus (64.1%, a difference of 0.030%), Zimbabwean (64.2%, a difference of 0.15%), Immigrants from Asia (64.0%, a difference of 0.15%), and Asian (64.2%, a difference of 0.17%).
| Demographics | Rating | Rank | College, 1 year or more |
| New Zealanders | 99.9 /100 | #49 | Exceptional 64.6% |
| Immigrants | Austria | 99.8 /100 | #50 | Exceptional 64.4% |
| Immigrants | Malaysia | 99.8 /100 | #51 | Exceptional 64.3% |
| Immigrants | Netherlands | 99.8 /100 | #52 | Exceptional 64.2% |
| Asians | 99.8 /100 | #53 | Exceptional 64.2% |
| Zimbabweans | 99.8 /100 | #54 | Exceptional 64.2% |
| Immigrants | Belarus | 99.7 /100 | #55 | Exceptional 64.1% |
| Immigrants | Czechoslovakia | 99.7 /100 | #56 | Exceptional 64.1% |
| South Africans | 99.7 /100 | #57 | Exceptional 64.1% |
| Immigrants | Asia | 99.7 /100 | #58 | Exceptional 64.0% |
| Immigrants | Serbia | 99.6 /100 | #59 | Exceptional 63.8% |
| Immigrants | Kazakhstan | 99.5 /100 | #60 | Exceptional 63.6% |
| Bolivians | 99.5 /100 | #61 | Exceptional 63.5% |
| Immigrants | Indonesia | 99.5 /100 | #62 | Exceptional 63.5% |
| Immigrants | Scotland | 99.4 /100 | #63 | Exceptional 63.4% |