Hawaiian vs Yuman College, 1 year or more
COMPARE
Hawaiian
Yuman
College, 1 year or more
College, 1 year or more Comparison
Hawaiians
Yuman
55.6%
COLLEGE, 1 YEAR OR MORE
0.8/ 100
METRIC RATING
247th/ 347
METRIC RANK
48.7%
COLLEGE, 1 YEAR OR MORE
0.0/ 100
METRIC RATING
335th/ 347
METRIC RANK
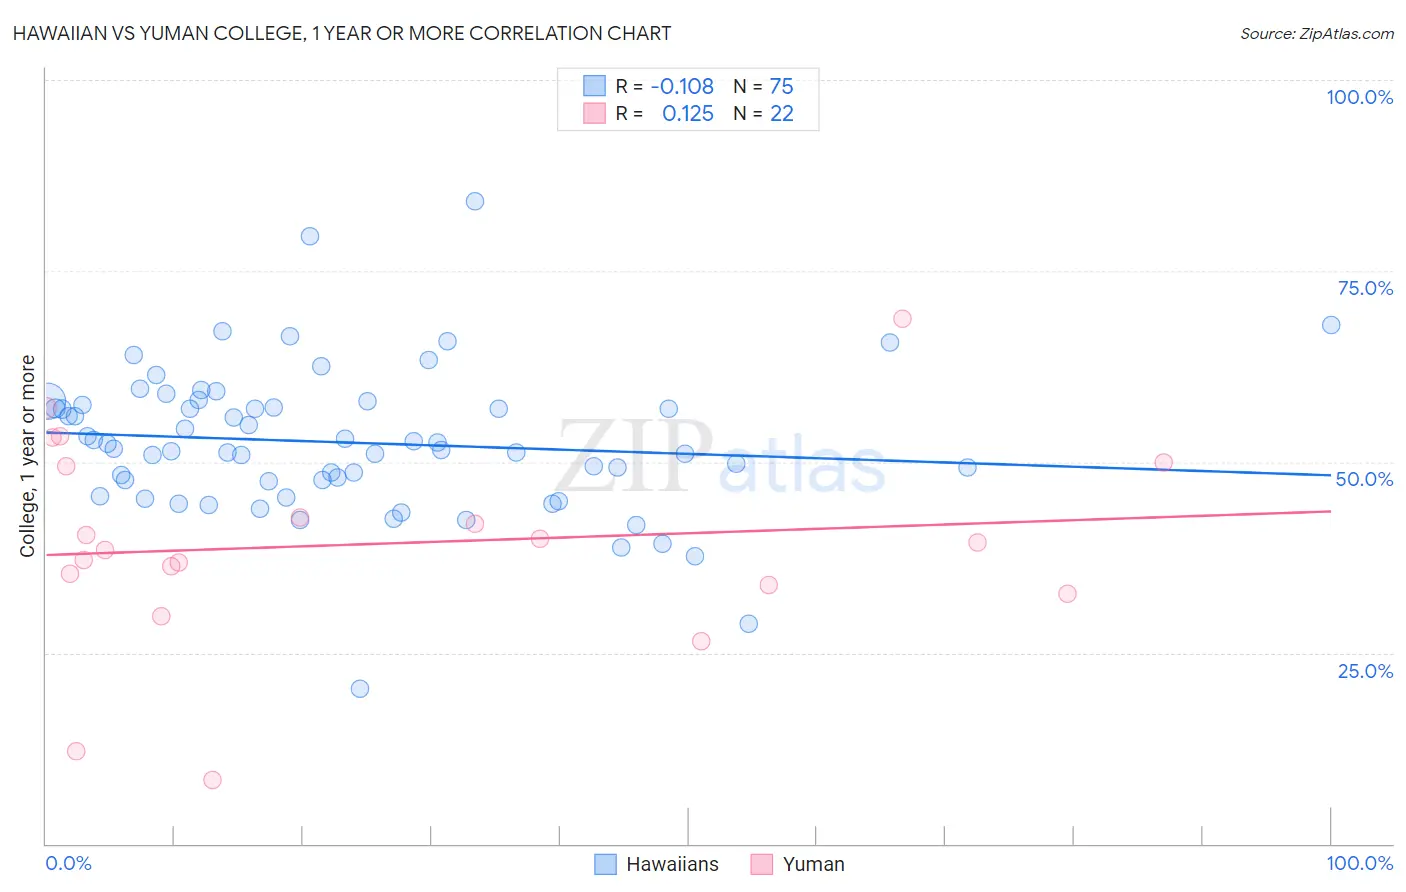
Hawaiian vs Yuman College, 1 year or more Correlation Chart
The statistical analysis conducted on geographies consisting of 327,619,549 people shows a poor negative correlation between the proportion of Hawaiians and percentage of population with at least college, 1 year or more education in the United States with a correlation coefficient (R) of -0.108 and weighted average of 55.6%. Similarly, the statistical analysis conducted on geographies consisting of 40,696,202 people shows a poor positive correlation between the proportion of Yuman and percentage of population with at least college, 1 year or more education in the United States with a correlation coefficient (R) of 0.125 and weighted average of 48.7%, a difference of 14.1%.
College, 1 year or more Correlation Summary
| Measurement | Hawaiian | Yuman |
| Minimum | 20.3% | 8.3% |
| Maximum | 84.1% | 68.8% |
| Range | 63.8% | 60.4% |
| Mean | 52.5% | 39.3% |
| Median | 51.7% | 39.0% |
| Interquartile 25% (IQ1) | 47.5% | 34.0% |
| Interquartile 75% (IQ3) | 57.4% | 49.5% |
| Interquartile Range (IQR) | 9.9% | 15.5% |
| Standard Deviation (Sample) | 9.7% | 13.6% |
| Standard Deviation (Population) | 9.7% | 13.3% |
Similar Demographics by College, 1 year or more
Demographics Similar to Hawaiians by College, 1 year or more
In terms of college, 1 year or more, the demographic groups most similar to Hawaiians are Immigrants from Congo (55.6%, a difference of 0.040%), Malaysian (55.6%, a difference of 0.070%), Immigrants from Liberia (55.7%, a difference of 0.12%), Immigrants from Trinidad and Tobago (55.5%, a difference of 0.13%), and Delaware (55.5%, a difference of 0.16%).
| Demographics | Rating | Rank | College, 1 year or more |
| Trinidadians and Tobagonians | 1.1 /100 | #240 | Tragic 55.8% |
| French American Indians | 1.0 /100 | #241 | Tragic 55.8% |
| Marshallese | 1.0 /100 | #242 | Tragic 55.8% |
| Osage | 1.0 /100 | #243 | Tragic 55.8% |
| Chippewa | 0.9 /100 | #244 | Tragic 55.7% |
| Immigrants | Liberia | 0.8 /100 | #245 | Tragic 55.7% |
| Malaysians | 0.8 /100 | #246 | Tragic 55.6% |
| Hawaiians | 0.8 /100 | #247 | Tragic 55.6% |
| Immigrants | Congo | 0.8 /100 | #248 | Tragic 55.6% |
| Immigrants | Trinidad and Tobago | 0.7 /100 | #249 | Tragic 55.5% |
| Delaware | 0.7 /100 | #250 | Tragic 55.5% |
| Immigrants | Cambodia | 0.6 /100 | #251 | Tragic 55.4% |
| Aleuts | 0.6 /100 | #252 | Tragic 55.4% |
| Immigrants | Barbados | 0.6 /100 | #253 | Tragic 55.4% |
| Japanese | 0.5 /100 | #254 | Tragic 55.2% |
Demographics Similar to Yuman by College, 1 year or more
In terms of college, 1 year or more, the demographic groups most similar to Yuman are Lumbee (48.9%, a difference of 0.28%), Spanish American Indian (48.5%, a difference of 0.44%), Pennsylvania German (48.5%, a difference of 0.45%), Immigrants from Central America (48.5%, a difference of 0.50%), and Immigrants from the Azores (48.4%, a difference of 0.76%).
| Demographics | Rating | Rank | College, 1 year or more |
| Dutch West Indians | 0.0 /100 | #328 | Tragic 50.5% |
| Cape Verdeans | 0.0 /100 | #329 | Tragic 50.3% |
| Natives/Alaskans | 0.0 /100 | #330 | Tragic 50.2% |
| Immigrants | Yemen | 0.0 /100 | #331 | Tragic 50.0% |
| Mexicans | 0.0 /100 | #332 | Tragic 49.2% |
| Immigrants | Dominican Republic | 0.0 /100 | #333 | Tragic 49.1% |
| Lumbee | 0.0 /100 | #334 | Tragic 48.9% |
| Yuman | 0.0 /100 | #335 | Tragic 48.7% |
| Spanish American Indians | 0.0 /100 | #336 | Tragic 48.5% |
| Pennsylvania Germans | 0.0 /100 | #337 | Tragic 48.5% |
| Immigrants | Central America | 0.0 /100 | #338 | Tragic 48.5% |
| Immigrants | Azores | 0.0 /100 | #339 | Tragic 48.4% |
| Immigrants | Cabo Verde | 0.0 /100 | #340 | Tragic 48.1% |
| Immigrants | Mexico | 0.0 /100 | #341 | Tragic 47.5% |
| Inupiat | 0.0 /100 | #342 | Tragic 47.2% |