Yaqui vs Immigrants from Czechoslovakia College, 1 year or more
COMPARE
Yaqui
Immigrants from Czechoslovakia
College, 1 year or more
College, 1 year or more Comparison
Yaqui
Immigrants from Czechoslovakia
53.2%
COLLEGE, 1 YEAR OR MORE
0.0/ 100
METRIC RATING
295th/ 347
METRIC RANK
64.1%
COLLEGE, 1 YEAR OR MORE
99.7/ 100
METRIC RATING
56th/ 347
METRIC RANK
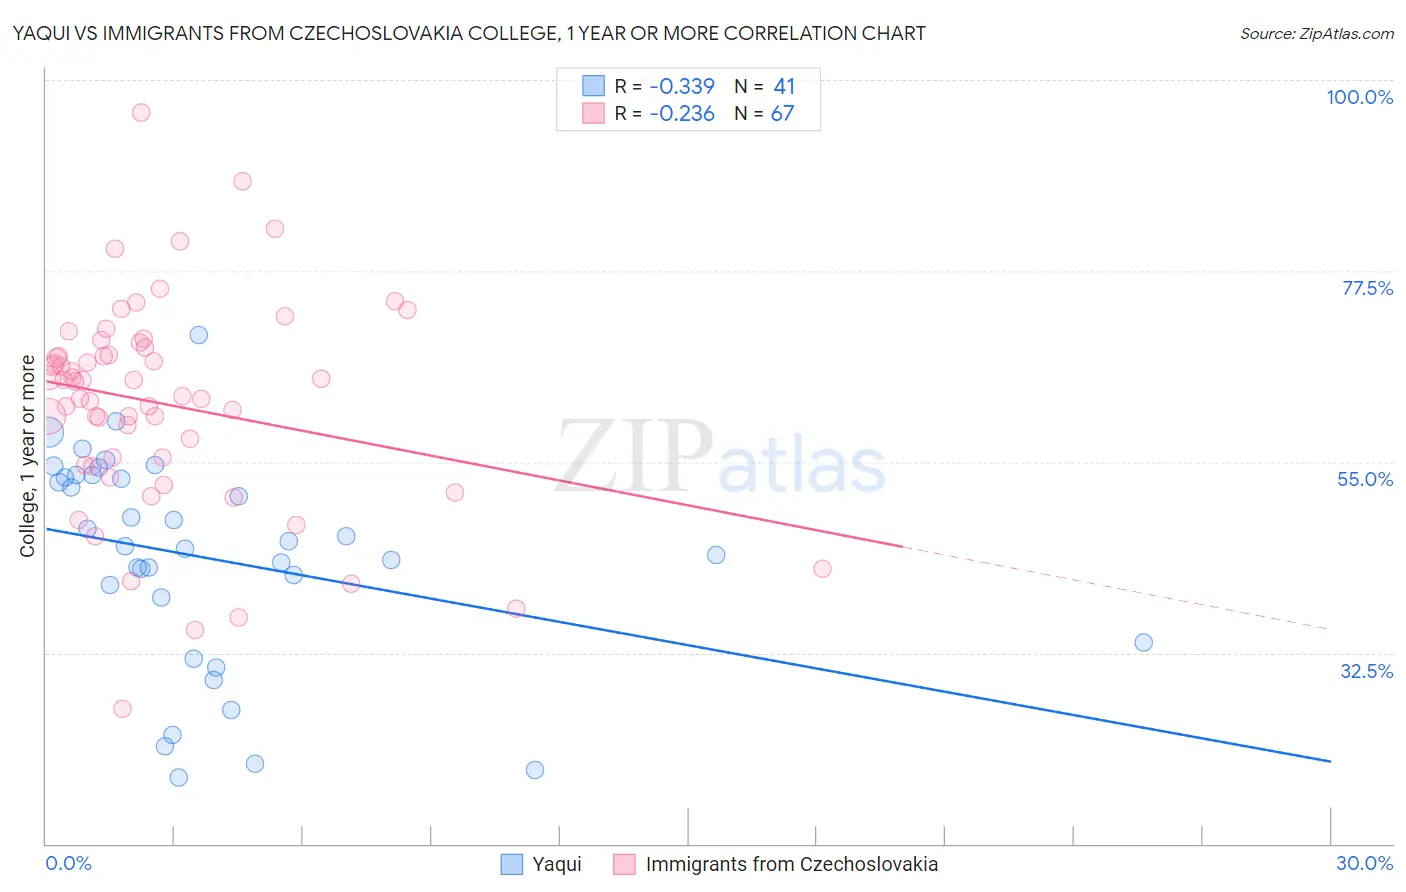
Yaqui vs Immigrants from Czechoslovakia College, 1 year or more Correlation Chart
The statistical analysis conducted on geographies consisting of 107,738,640 people shows a mild negative correlation between the proportion of Yaqui and percentage of population with at least college, 1 year or more education in the United States with a correlation coefficient (R) of -0.339 and weighted average of 53.2%. Similarly, the statistical analysis conducted on geographies consisting of 195,448,477 people shows a weak negative correlation between the proportion of Immigrants from Czechoslovakia and percentage of population with at least college, 1 year or more education in the United States with a correlation coefficient (R) of -0.236 and weighted average of 64.1%, a difference of 20.5%.
College, 1 year or more Correlation Summary
| Measurement | Yaqui | Immigrants from Czechoslovakia |
| Minimum | 17.9% | 26.0% |
| Maximum | 69.9% | 96.2% |
| Range | 52.0% | 70.3% |
| Mean | 43.6% | 61.8% |
| Median | 45.0% | 64.5% |
| Interquartile 25% (IQ1) | 36.3% | 54.6% |
| Interquartile 75% (IQ3) | 53.3% | 68.5% |
| Interquartile Range (IQR) | 17.0% | 13.8% |
| Standard Deviation (Sample) | 12.5% | 12.5% |
| Standard Deviation (Population) | 12.3% | 12.4% |
Similar Demographics by College, 1 year or more
Demographics Similar to Yaqui by College, 1 year or more
In terms of college, 1 year or more, the demographic groups most similar to Yaqui are Cherokee (53.2%, a difference of 0.010%), Black/African American (53.3%, a difference of 0.23%), Chickasaw (53.3%, a difference of 0.25%), Sioux (53.0%, a difference of 0.34%), and Cuban (53.4%, a difference of 0.38%).
| Demographics | Rating | Rank | College, 1 year or more |
| Alaska Natives | 0.0 /100 | #288 | Tragic 53.4% |
| Immigrants | Ecuador | 0.0 /100 | #289 | Tragic 53.4% |
| Alaskan Athabascans | 0.0 /100 | #290 | Tragic 53.4% |
| Cubans | 0.0 /100 | #291 | Tragic 53.4% |
| Chickasaw | 0.0 /100 | #292 | Tragic 53.3% |
| Blacks/African Americans | 0.0 /100 | #293 | Tragic 53.3% |
| Cherokee | 0.0 /100 | #294 | Tragic 53.2% |
| Yaqui | 0.0 /100 | #295 | Tragic 53.2% |
| Sioux | 0.0 /100 | #296 | Tragic 53.0% |
| Paiute | 0.0 /100 | #297 | Tragic 52.9% |
| Immigrants | Dominica | 0.0 /100 | #298 | Tragic 52.5% |
| Immigrants | Nicaragua | 0.0 /100 | #299 | Tragic 52.4% |
| Choctaw | 0.0 /100 | #300 | Tragic 52.3% |
| Haitians | 0.0 /100 | #301 | Tragic 52.3% |
| Puerto Ricans | 0.0 /100 | #302 | Tragic 52.2% |
Demographics Similar to Immigrants from Czechoslovakia by College, 1 year or more
In terms of college, 1 year or more, the demographic groups most similar to Immigrants from Czechoslovakia are South African (64.1%, a difference of 0.010%), Immigrants from Belarus (64.1%, a difference of 0.030%), Zimbabwean (64.2%, a difference of 0.15%), Immigrants from Asia (64.0%, a difference of 0.15%), and Asian (64.2%, a difference of 0.17%).
| Demographics | Rating | Rank | College, 1 year or more |
| New Zealanders | 99.9 /100 | #49 | Exceptional 64.6% |
| Immigrants | Austria | 99.8 /100 | #50 | Exceptional 64.4% |
| Immigrants | Malaysia | 99.8 /100 | #51 | Exceptional 64.3% |
| Immigrants | Netherlands | 99.8 /100 | #52 | Exceptional 64.2% |
| Asians | 99.8 /100 | #53 | Exceptional 64.2% |
| Zimbabweans | 99.8 /100 | #54 | Exceptional 64.2% |
| Immigrants | Belarus | 99.7 /100 | #55 | Exceptional 64.1% |
| Immigrants | Czechoslovakia | 99.7 /100 | #56 | Exceptional 64.1% |
| South Africans | 99.7 /100 | #57 | Exceptional 64.1% |
| Immigrants | Asia | 99.7 /100 | #58 | Exceptional 64.0% |
| Immigrants | Serbia | 99.6 /100 | #59 | Exceptional 63.8% |
| Immigrants | Kazakhstan | 99.5 /100 | #60 | Exceptional 63.6% |
| Bolivians | 99.5 /100 | #61 | Exceptional 63.5% |
| Immigrants | Indonesia | 99.5 /100 | #62 | Exceptional 63.5% |
| Immigrants | Scotland | 99.4 /100 | #63 | Exceptional 63.4% |