Hawaiian vs Celtic Median Male Earnings
COMPARE
Hawaiian
Celtic
Median Male Earnings
Median Male Earnings Comparison
Hawaiians
Celtics
$50,488
MEDIAN MALE EARNINGS
1.9/ 100
METRIC RATING
245th/ 347
METRIC RANK
$54,242
MEDIAN MALE EARNINGS
43.9/ 100
METRIC RATING
179th/ 347
METRIC RANK
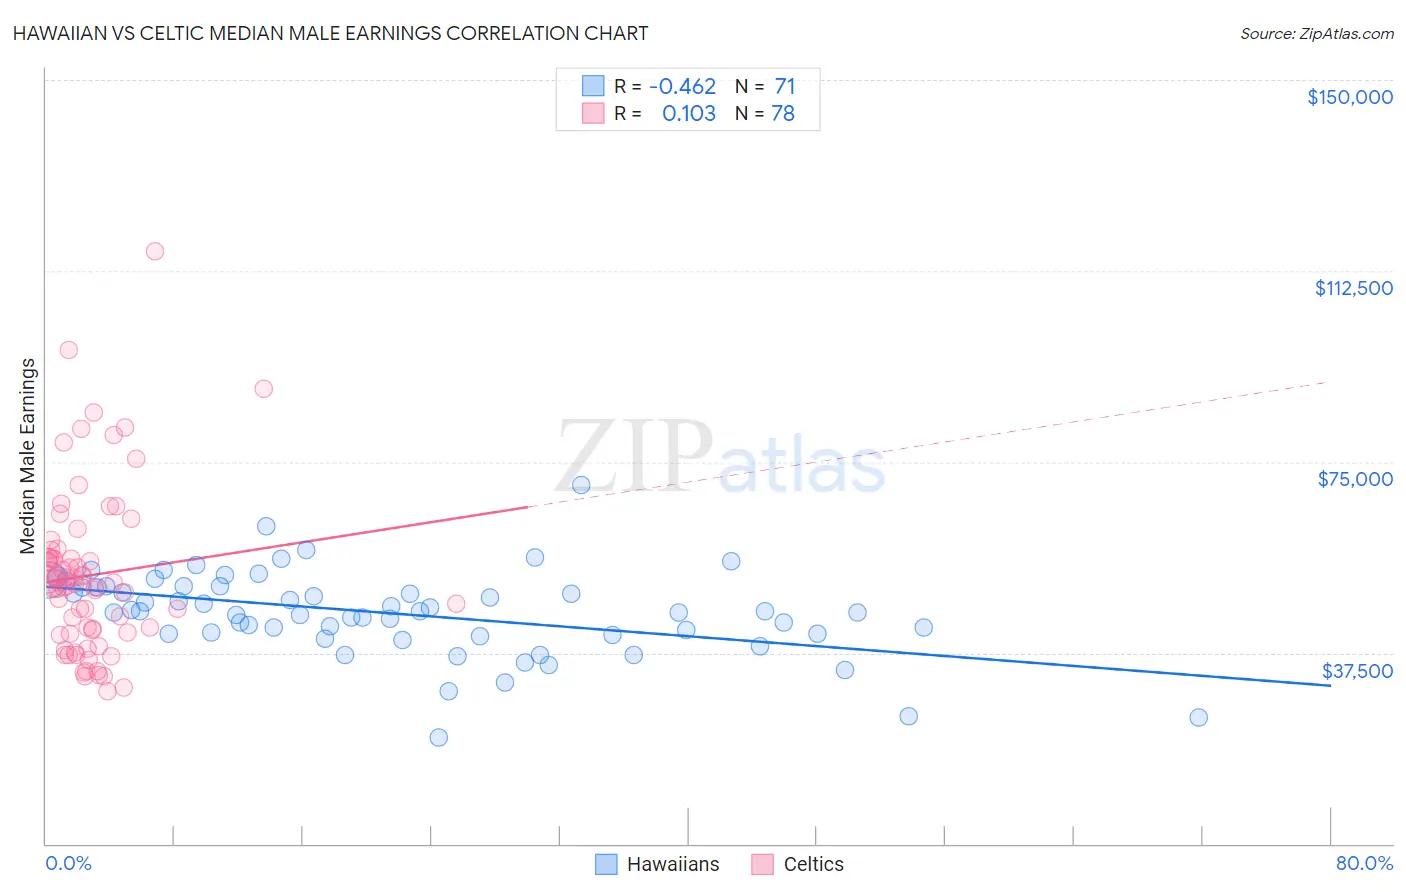
Hawaiian vs Celtic Median Male Earnings Correlation Chart
The statistical analysis conducted on geographies consisting of 327,518,939 people shows a moderate negative correlation between the proportion of Hawaiians and median male earnings in the United States with a correlation coefficient (R) of -0.462 and weighted average of $50,488. Similarly, the statistical analysis conducted on geographies consisting of 168,835,253 people shows a poor positive correlation between the proportion of Celtics and median male earnings in the United States with a correlation coefficient (R) of 0.103 and weighted average of $54,242, a difference of 7.4%.
Median Male Earnings Correlation Summary
| Measurement | Hawaiian | Celtic |
| Minimum | $20,774 | $30,000 |
| Maximum | $70,362 | $116,250 |
| Range | $49,588 | $86,250 |
| Mean | $45,275 | $52,737 |
| Median | $45,568 | $51,157 |
| Interquartile 25% (IQ1) | $41,232 | $41,563 |
| Interquartile 75% (IQ3) | $50,512 | $56,235 |
| Interquartile Range (IQR) | $9,280 | $14,672 |
| Standard Deviation (Sample) | $8,332 | $16,099 |
| Standard Deviation (Population) | $8,273 | $15,995 |
Similar Demographics by Median Male Earnings
Demographics Similar to Hawaiians by Median Male Earnings
In terms of median male earnings, the demographic groups most similar to Hawaiians are Immigrants from Ecuador ($50,474, a difference of 0.030%), Houma ($50,547, a difference of 0.12%), Subsaharan African ($50,408, a difference of 0.16%), French American Indian ($50,611, a difference of 0.24%), and Guyanese ($50,613, a difference of 0.25%).
| Demographics | Rating | Rank | Median Male Earnings |
| Malaysians | 2.5 /100 | #238 | Tragic $50,772 |
| Americans | 2.5 /100 | #239 | Tragic $50,761 |
| West Indians | 2.3 /100 | #240 | Tragic $50,682 |
| Immigrants | St. Vincent and the Grenadines | 2.3 /100 | #241 | Tragic $50,665 |
| Guyanese | 2.2 /100 | #242 | Tragic $50,613 |
| French American Indians | 2.2 /100 | #243 | Tragic $50,611 |
| Houma | 2.0 /100 | #244 | Tragic $50,547 |
| Hawaiians | 1.9 /100 | #245 | Tragic $50,488 |
| Immigrants | Ecuador | 1.9 /100 | #246 | Tragic $50,474 |
| Sub-Saharan Africans | 1.8 /100 | #247 | Tragic $50,408 |
| Immigrants | Guyana | 1.6 /100 | #248 | Tragic $50,321 |
| Immigrants | Burma/Myanmar | 1.6 /100 | #249 | Tragic $50,298 |
| Osage | 1.6 /100 | #250 | Tragic $50,292 |
| Immigrants | Grenada | 1.6 /100 | #251 | Tragic $50,279 |
| Immigrants | Cabo Verde | 1.2 /100 | #252 | Tragic $50,009 |
Demographics Similar to Celtics by Median Male Earnings
In terms of median male earnings, the demographic groups most similar to Celtics are Costa Rican ($54,279, a difference of 0.070%), Sierra Leonean ($54,279, a difference of 0.070%), Iraqi ($54,182, a difference of 0.11%), Immigrants ($54,168, a difference of 0.14%), and Spaniard ($54,401, a difference of 0.29%).
| Demographics | Rating | Rank | Median Male Earnings |
| Welsh | 53.8 /100 | #172 | Average $54,647 |
| South American Indians | 50.4 /100 | #173 | Average $54,508 |
| South Americans | 50.0 /100 | #174 | Average $54,492 |
| Dutch | 48.0 /100 | #175 | Average $54,410 |
| Spaniards | 47.8 /100 | #176 | Average $54,401 |
| Costa Ricans | 44.8 /100 | #177 | Average $54,279 |
| Sierra Leoneans | 44.8 /100 | #178 | Average $54,279 |
| Celtics | 43.9 /100 | #179 | Average $54,242 |
| Iraqis | 42.5 /100 | #180 | Average $54,182 |
| Immigrants | Immigrants | 42.1 /100 | #181 | Average $54,168 |
| Yugoslavians | 37.4 /100 | #182 | Fair $53,967 |
| Immigrants | South America | 37.3 /100 | #183 | Fair $53,962 |
| Whites/Caucasians | 36.5 /100 | #184 | Fair $53,925 |
| Immigrants | Sierra Leone | 36.0 /100 | #185 | Fair $53,905 |
| Colombians | 34.4 /100 | #186 | Fair $53,832 |