Hawaiian vs Apache Doctorate Degree
COMPARE
Hawaiian
Apache
Doctorate Degree
Doctorate Degree Comparison
Hawaiians
Apache
1.5%
DOCTORATE DEGREE
0.4/ 100
METRIC RATING
278th/ 347
METRIC RANK
1.5%
DOCTORATE DEGREE
1.3/ 100
METRIC RATING
251st/ 347
METRIC RANK
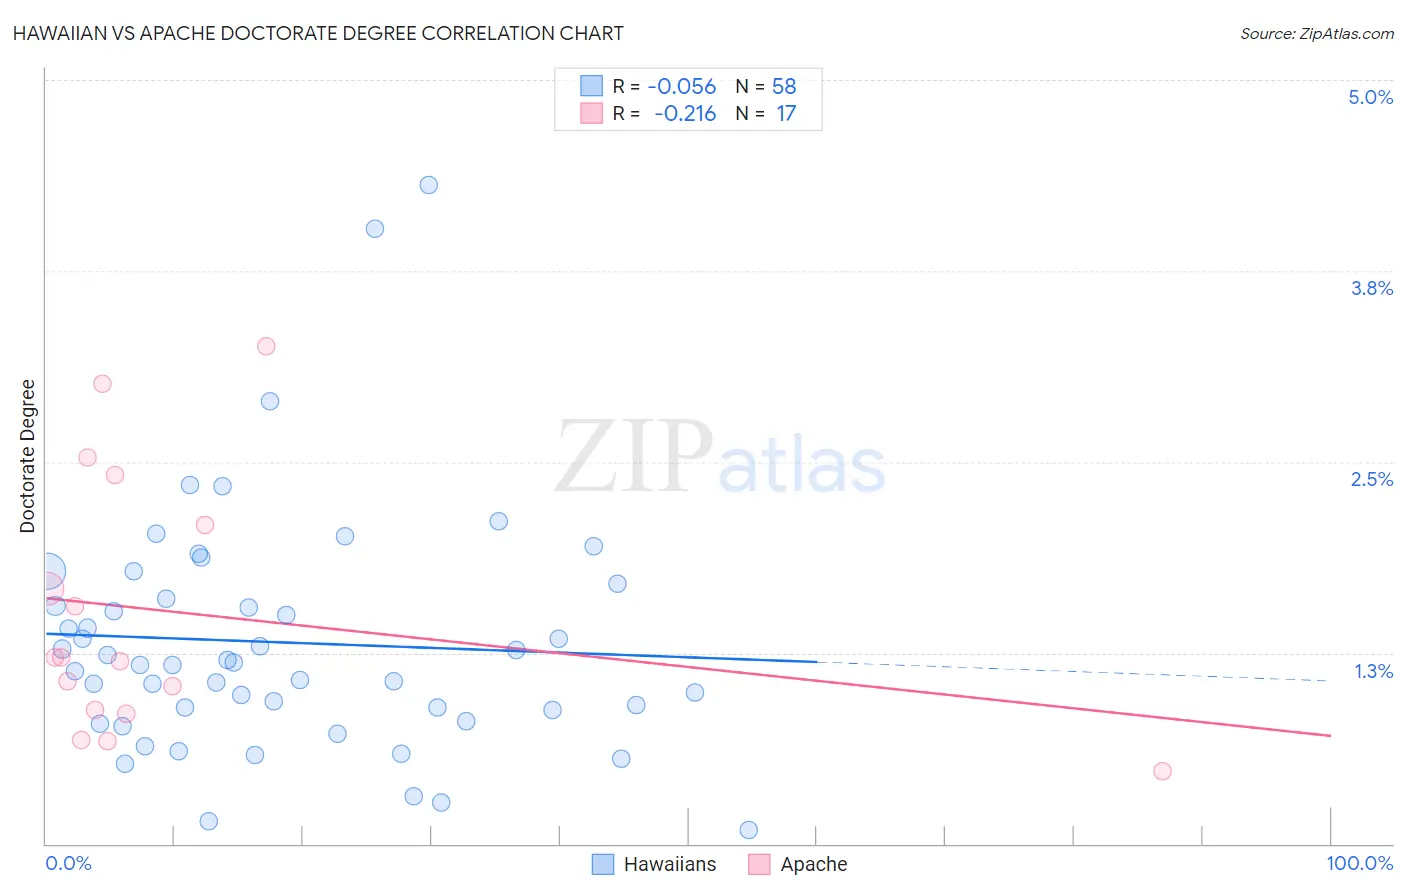
Hawaiian vs Apache Doctorate Degree Correlation Chart
The statistical analysis conducted on geographies consisting of 323,773,151 people shows a slight negative correlation between the proportion of Hawaiians and percentage of population with at least doctorate degree education in the United States with a correlation coefficient (R) of -0.056 and weighted average of 1.5%. Similarly, the statistical analysis conducted on geographies consisting of 228,067,045 people shows a weak negative correlation between the proportion of Apache and percentage of population with at least doctorate degree education in the United States with a correlation coefficient (R) of -0.216 and weighted average of 1.5%, a difference of 5.8%.
Doctorate Degree Correlation Summary
| Measurement | Hawaiian | Apache |
| Minimum | 0.092% | 0.48% |
| Maximum | 4.3% | 3.3% |
| Range | 4.2% | 2.8% |
| Mean | 1.3% | 1.5% |
| Median | 1.2% | 1.2% |
| Interquartile 25% (IQ1) | 0.88% | 0.86% |
| Interquartile 75% (IQ3) | 1.6% | 2.3% |
| Interquartile Range (IQR) | 0.73% | 1.4% |
| Standard Deviation (Sample) | 0.79% | 0.85% |
| Standard Deviation (Population) | 0.78% | 0.82% |
Similar Demographics by Doctorate Degree
Demographics Similar to Hawaiians by Doctorate Degree
In terms of doctorate degree, the demographic groups most similar to Hawaiians are Bahamian (1.5%, a difference of 0.060%), Marshallese (1.5%, a difference of 0.22%), Ecuadorian (1.5%, a difference of 0.23%), Tohono O'odham (1.5%, a difference of 0.30%), and British West Indian (1.5%, a difference of 0.35%).
| Demographics | Rating | Rank | Doctorate Degree |
| Immigrants | Trinidad and Tobago | 0.5 /100 | #271 | Tragic 1.5% |
| Immigrants | Barbados | 0.4 /100 | #272 | Tragic 1.5% |
| Sioux | 0.4 /100 | #273 | Tragic 1.5% |
| Yaqui | 0.4 /100 | #274 | Tragic 1.5% |
| Aleuts | 0.4 /100 | #275 | Tragic 1.5% |
| Paiute | 0.4 /100 | #276 | Tragic 1.5% |
| Bahamians | 0.4 /100 | #277 | Tragic 1.5% |
| Hawaiians | 0.4 /100 | #278 | Tragic 1.5% |
| Marshallese | 0.4 /100 | #279 | Tragic 1.5% |
| Ecuadorians | 0.4 /100 | #280 | Tragic 1.5% |
| Tohono O'odham | 0.4 /100 | #281 | Tragic 1.5% |
| British West Indians | 0.3 /100 | #282 | Tragic 1.5% |
| Central Americans | 0.3 /100 | #283 | Tragic 1.5% |
| Jamaicans | 0.3 /100 | #284 | Tragic 1.5% |
| Malaysians | 0.3 /100 | #285 | Tragic 1.5% |
Demographics Similar to Apache by Doctorate Degree
In terms of doctorate degree, the demographic groups most similar to Apache are Immigrants from Fiji (1.6%, a difference of 0.87%), Potawatomi (1.6%, a difference of 0.90%), Yuman (1.5%, a difference of 0.92%), American (1.5%, a difference of 1.1%), and Immigrants from Cambodia (1.5%, a difference of 1.2%).
| Demographics | Rating | Rank | Doctorate Degree |
| French American Indians | 2.0 /100 | #244 | Tragic 1.6% |
| Delaware | 1.9 /100 | #245 | Tragic 1.6% |
| Hmong | 1.8 /100 | #246 | Tragic 1.6% |
| Comanche | 1.8 /100 | #247 | Tragic 1.6% |
| Africans | 1.8 /100 | #248 | Tragic 1.6% |
| Potawatomi | 1.6 /100 | #249 | Tragic 1.6% |
| Immigrants | Fiji | 1.6 /100 | #250 | Tragic 1.6% |
| Apache | 1.3 /100 | #251 | Tragic 1.5% |
| Yuman | 1.1 /100 | #252 | Tragic 1.5% |
| Americans | 1.0 /100 | #253 | Tragic 1.5% |
| Immigrants | Cambodia | 1.0 /100 | #254 | Tragic 1.5% |
| Trinidadians and Tobagonians | 1.0 /100 | #255 | Tragic 1.5% |
| Central American Indians | 1.0 /100 | #256 | Tragic 1.5% |
| Chippewa | 0.9 /100 | #257 | Tragic 1.5% |
| Immigrants | West Indies | 0.9 /100 | #258 | Tragic 1.5% |