Haitian vs Maltese Disability Age Under 5
COMPARE
Haitian
Maltese
Disability Age Under 5
Disability Age Under 5 Comparison
Haitians
Maltese
1.3%
DISABILITY AGE UNDER 5
39.9/ 100
METRIC RATING
188th/ 347
METRIC RANK
1.3%
DISABILITY AGE UNDER 5
2.2/ 100
METRIC RATING
241st/ 347
METRIC RANK
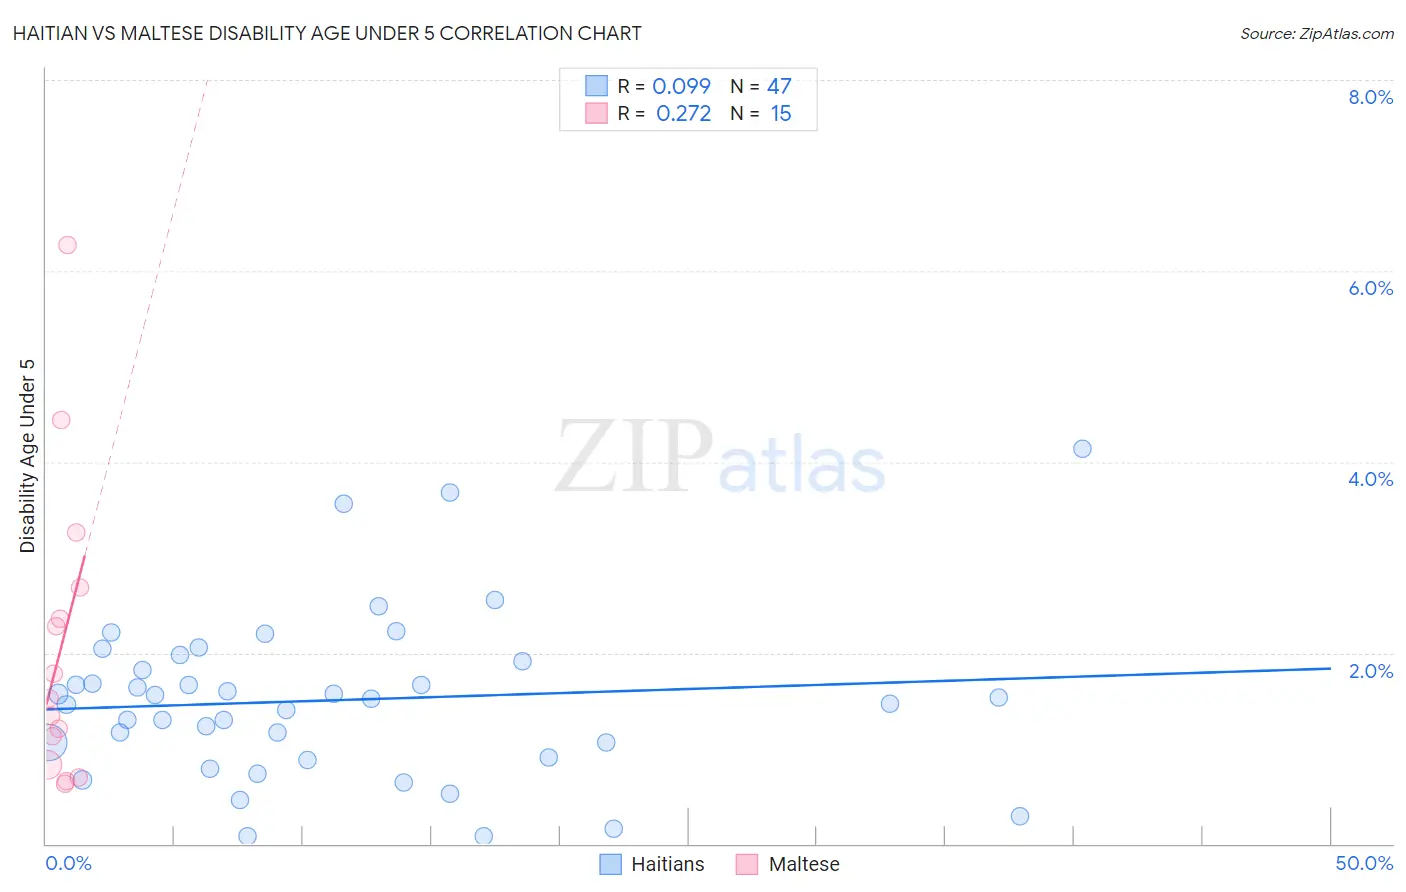
Haitian vs Maltese Disability Age Under 5 Correlation Chart
The statistical analysis conducted on geographies consisting of 169,174,150 people shows a slight positive correlation between the proportion of Haitians and percentage of population with a disability under the age of 5 in the United States with a correlation coefficient (R) of 0.099 and weighted average of 1.3%. Similarly, the statistical analysis conducted on geographies consisting of 87,586,086 people shows a weak positive correlation between the proportion of Maltese and percentage of population with a disability under the age of 5 in the United States with a correlation coefficient (R) of 0.272 and weighted average of 1.3%, a difference of 7.6%.
Disability Age Under 5 Correlation Summary
| Measurement | Haitian | Maltese |
| Minimum | 0.082% | 0.63% |
| Maximum | 4.1% | 6.3% |
| Range | 4.0% | 5.6% |
| Mean | 1.5% | 2.1% |
| Median | 1.5% | 1.5% |
| Interquartile 25% (IQ1) | 0.90% | 0.83% |
| Interquartile 75% (IQ3) | 1.9% | 2.7% |
| Interquartile Range (IQR) | 1.0% | 1.9% |
| Standard Deviation (Sample) | 0.86% | 1.6% |
| Standard Deviation (Population) | 0.85% | 1.5% |
Similar Demographics by Disability Age Under 5
Demographics Similar to Haitians by Disability Age Under 5
In terms of disability age under 5, the demographic groups most similar to Haitians are Immigrants from Haiti (1.3%, a difference of 0.020%), Peruvian (1.3%, a difference of 0.22%), Cuban (1.2%, a difference of 0.23%), Immigrants from Western Africa (1.2%, a difference of 0.24%), and Palestinian (1.2%, a difference of 0.29%).
| Demographics | Rating | Rank | Disability Age Under 5 |
| Macedonians | 43.7 /100 | #181 | Average 1.2% |
| Immigrants | Peru | 43.7 /100 | #181 | Average 1.2% |
| Immigrants | Saudi Arabia | 43.3 /100 | #183 | Average 1.2% |
| Palestinians | 43.0 /100 | #184 | Average 1.2% |
| Immigrants | Western Africa | 42.5 /100 | #185 | Average 1.2% |
| Cubans | 42.5 /100 | #186 | Average 1.2% |
| Immigrants | Haiti | 40.2 /100 | #187 | Average 1.3% |
| Haitians | 39.9 /100 | #188 | Fair 1.3% |
| Peruvians | 37.6 /100 | #189 | Fair 1.3% |
| Immigrants | Laos | 36.6 /100 | #190 | Fair 1.3% |
| Mexican American Indians | 36.6 /100 | #191 | Fair 1.3% |
| Immigrants | Bosnia and Herzegovina | 36.5 /100 | #192 | Fair 1.3% |
| Immigrants | Sierra Leone | 36.5 /100 | #193 | Fair 1.3% |
| Immigrants | North Macedonia | 34.7 /100 | #194 | Fair 1.3% |
| U.S. Virgin Islanders | 34.4 /100 | #195 | Fair 1.3% |
Demographics Similar to Maltese by Disability Age Under 5
In terms of disability age under 5, the demographic groups most similar to Maltese are Native Hawaiian (1.3%, a difference of 0.070%), Lumbee (1.3%, a difference of 0.080%), Immigrants from Austria (1.3%, a difference of 0.090%), Spanish American Indian (1.3%, a difference of 0.25%), and Immigrants from Cameroon (1.4%, a difference of 0.46%).
| Demographics | Rating | Rank | Disability Age Under 5 |
| Pueblo | 3.8 /100 | #234 | Tragic 1.3% |
| Central American Indians | 3.6 /100 | #235 | Tragic 1.3% |
| South American Indians | 3.3 /100 | #236 | Tragic 1.3% |
| Basques | 3.0 /100 | #237 | Tragic 1.3% |
| Spanish American Indians | 2.4 /100 | #238 | Tragic 1.3% |
| Immigrants | Austria | 2.3 /100 | #239 | Tragic 1.3% |
| Native Hawaiians | 2.2 /100 | #240 | Tragic 1.3% |
| Maltese | 2.2 /100 | #241 | Tragic 1.3% |
| Lumbee | 2.1 /100 | #242 | Tragic 1.3% |
| Immigrants | Cameroon | 1.7 /100 | #243 | Tragic 1.4% |
| Spaniards | 1.4 /100 | #244 | Tragic 1.4% |
| Potawatomi | 1.1 /100 | #245 | Tragic 1.4% |
| Russians | 1.0 /100 | #246 | Tragic 1.4% |
| Immigrants | England | 1.0 /100 | #247 | Tragic 1.4% |
| Eastern Europeans | 1.0 /100 | #248 | Tragic 1.4% |