Israeli vs Immigrants from South Africa High School Diploma
COMPARE
Israeli
Immigrants from South Africa
High School Diploma
High School Diploma Comparison
Israelis
Immigrants from South Africa
90.1%
HIGH SCHOOL DIPLOMA
95.1/ 100
METRIC RATING
118th/ 347
METRIC RANK
91.0%
HIGH SCHOOL DIPLOMA
99.6/ 100
METRIC RATING
65th/ 347
METRIC RANK
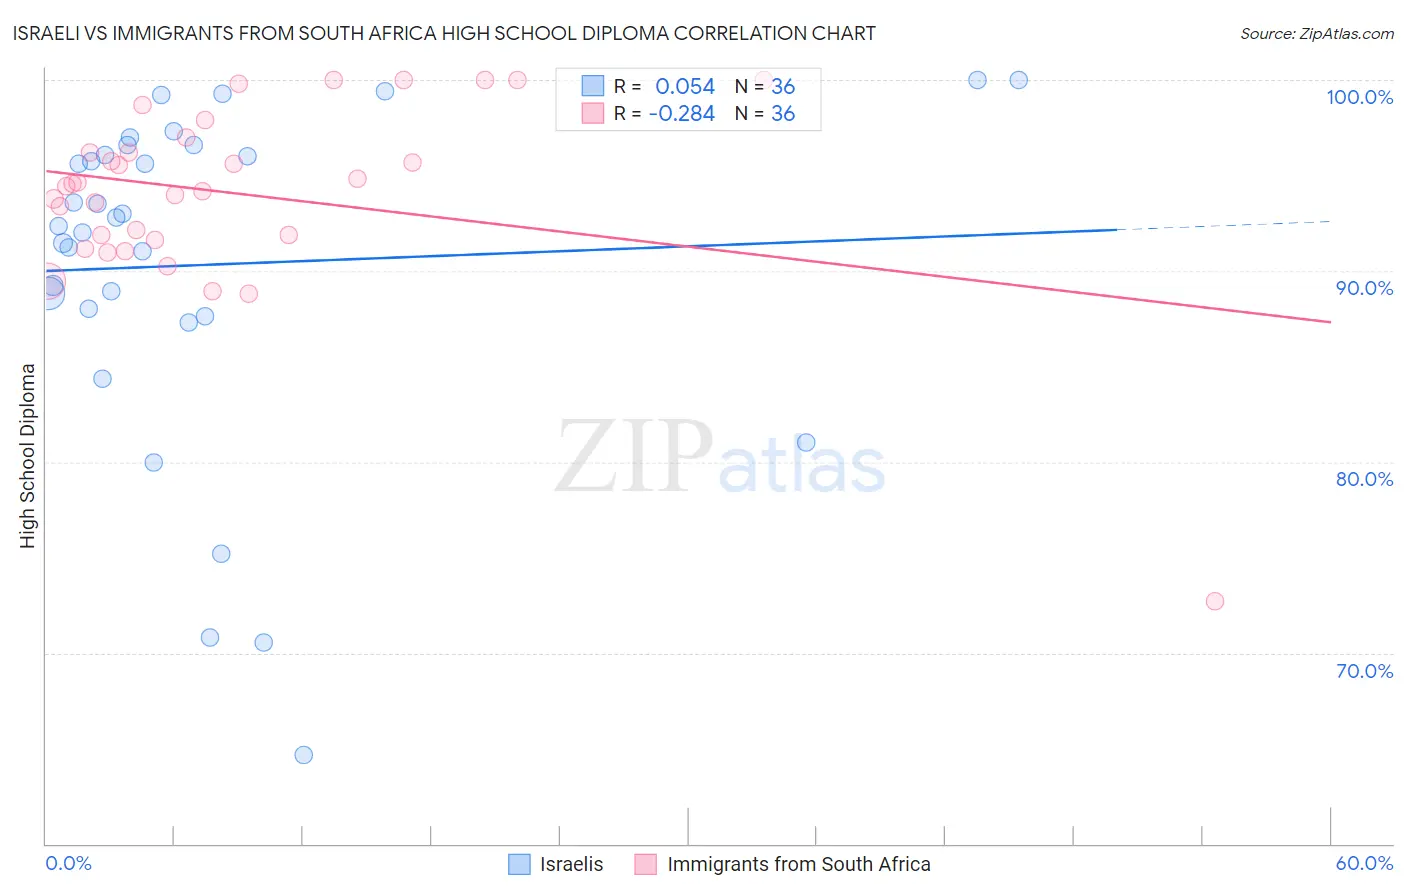
Israeli vs Immigrants from South Africa High School Diploma Correlation Chart
The statistical analysis conducted on geographies consisting of 211,220,500 people shows a slight positive correlation between the proportion of Israelis and percentage of population with at least high school diploma education in the United States with a correlation coefficient (R) of 0.054 and weighted average of 90.1%. Similarly, the statistical analysis conducted on geographies consisting of 233,321,693 people shows a weak negative correlation between the proportion of Immigrants from South Africa and percentage of population with at least high school diploma education in the United States with a correlation coefficient (R) of -0.284 and weighted average of 91.0%, a difference of 0.91%.
High School Diploma Correlation Summary
| Measurement | Israeli | Immigrants from South Africa |
| Minimum | 64.7% | 72.7% |
| Maximum | 100.0% | 100.0% |
| Range | 35.3% | 27.3% |
| Mean | 90.3% | 94.1% |
| Median | 92.6% | 94.5% |
| Interquartile 25% (IQ1) | 87.8% | 91.8% |
| Interquartile 75% (IQ3) | 96.3% | 96.6% |
| Interquartile Range (IQR) | 8.5% | 4.8% |
| Standard Deviation (Sample) | 8.8% | 5.0% |
| Standard Deviation (Population) | 8.7% | 4.9% |
Similar Demographics by High School Diploma
Demographics Similar to Israelis by High School Diploma
In terms of high school diploma, the demographic groups most similar to Israelis are Jordanian (90.2%, a difference of 0.020%), Immigrants from Eastern Europe (90.1%, a difference of 0.020%), Immigrants from Germany (90.2%, a difference of 0.050%), Ottawa (90.1%, a difference of 0.050%), and Immigrants from Hungary (90.2%, a difference of 0.060%).
| Demographics | Rating | Rank | High School Diploma |
| Menominee | 96.6 /100 | #111 | Exceptional 90.3% |
| Immigrants | Belarus | 96.4 /100 | #112 | Exceptional 90.2% |
| Immigrants | Sri Lanka | 96.3 /100 | #113 | Exceptional 90.2% |
| Yugoslavians | 96.2 /100 | #114 | Exceptional 90.2% |
| Immigrants | Hungary | 95.8 /100 | #115 | Exceptional 90.2% |
| Immigrants | Germany | 95.7 /100 | #116 | Exceptional 90.2% |
| Jordanians | 95.4 /100 | #117 | Exceptional 90.2% |
| Israelis | 95.1 /100 | #118 | Exceptional 90.1% |
| Immigrants | Eastern Europe | 94.9 /100 | #119 | Exceptional 90.1% |
| Ottawa | 94.4 /100 | #120 | Exceptional 90.1% |
| Whites/Caucasians | 94.1 /100 | #121 | Exceptional 90.1% |
| Immigrants | Kazakhstan | 93.4 /100 | #122 | Exceptional 90.0% |
| German Russians | 92.0 /100 | #123 | Exceptional 90.0% |
| Mongolians | 91.6 /100 | #124 | Exceptional 89.9% |
| Egyptians | 91.1 /100 | #125 | Exceptional 89.9% |
Demographics Similar to Immigrants from South Africa by High School Diploma
In terms of high school diploma, the demographic groups most similar to Immigrants from South Africa are Ukrainian (91.0%, a difference of 0.0%), Immigrants from Netherlands (91.0%, a difference of 0.010%), French (91.0%, a difference of 0.010%), Immigrants from Iran (90.9%, a difference of 0.030%), and Austrian (91.0%, a difference of 0.040%).
| Demographics | Rating | Rank | High School Diploma |
| Slavs | 99.7 /100 | #58 | Exceptional 91.0% |
| Immigrants | North America | 99.7 /100 | #59 | Exceptional 91.0% |
| Immigrants | Japan | 99.6 /100 | #60 | Exceptional 91.0% |
| Immigrants | Taiwan | 99.6 /100 | #61 | Exceptional 91.0% |
| Austrians | 99.6 /100 | #62 | Exceptional 91.0% |
| Immigrants | Netherlands | 99.6 /100 | #63 | Exceptional 91.0% |
| Ukrainians | 99.6 /100 | #64 | Exceptional 91.0% |
| Immigrants | South Africa | 99.6 /100 | #65 | Exceptional 91.0% |
| French | 99.5 /100 | #66 | Exceptional 91.0% |
| Immigrants | Iran | 99.5 /100 | #67 | Exceptional 90.9% |
| Czechoslovakians | 99.5 /100 | #68 | Exceptional 90.9% |
| French Canadians | 99.5 /100 | #69 | Exceptional 90.9% |
| Immigrants | Latvia | 99.5 /100 | #70 | Exceptional 90.9% |
| Alaskan Athabascans | 99.4 /100 | #71 | Exceptional 90.9% |
| Soviet Union | 99.4 /100 | #72 | Exceptional 90.9% |