Immigrants from Zimbabwe vs Immigrants from South Africa High School Diploma
COMPARE
Immigrants from Zimbabwe
Immigrants from South Africa
High School Diploma
High School Diploma Comparison
Immigrants from Zimbabwe
Immigrants from South Africa
90.3%
HIGH SCHOOL DIPLOMA
96.7/ 100
METRIC RATING
109th/ 347
METRIC RANK
91.0%
HIGH SCHOOL DIPLOMA
99.6/ 100
METRIC RATING
65th/ 347
METRIC RANK
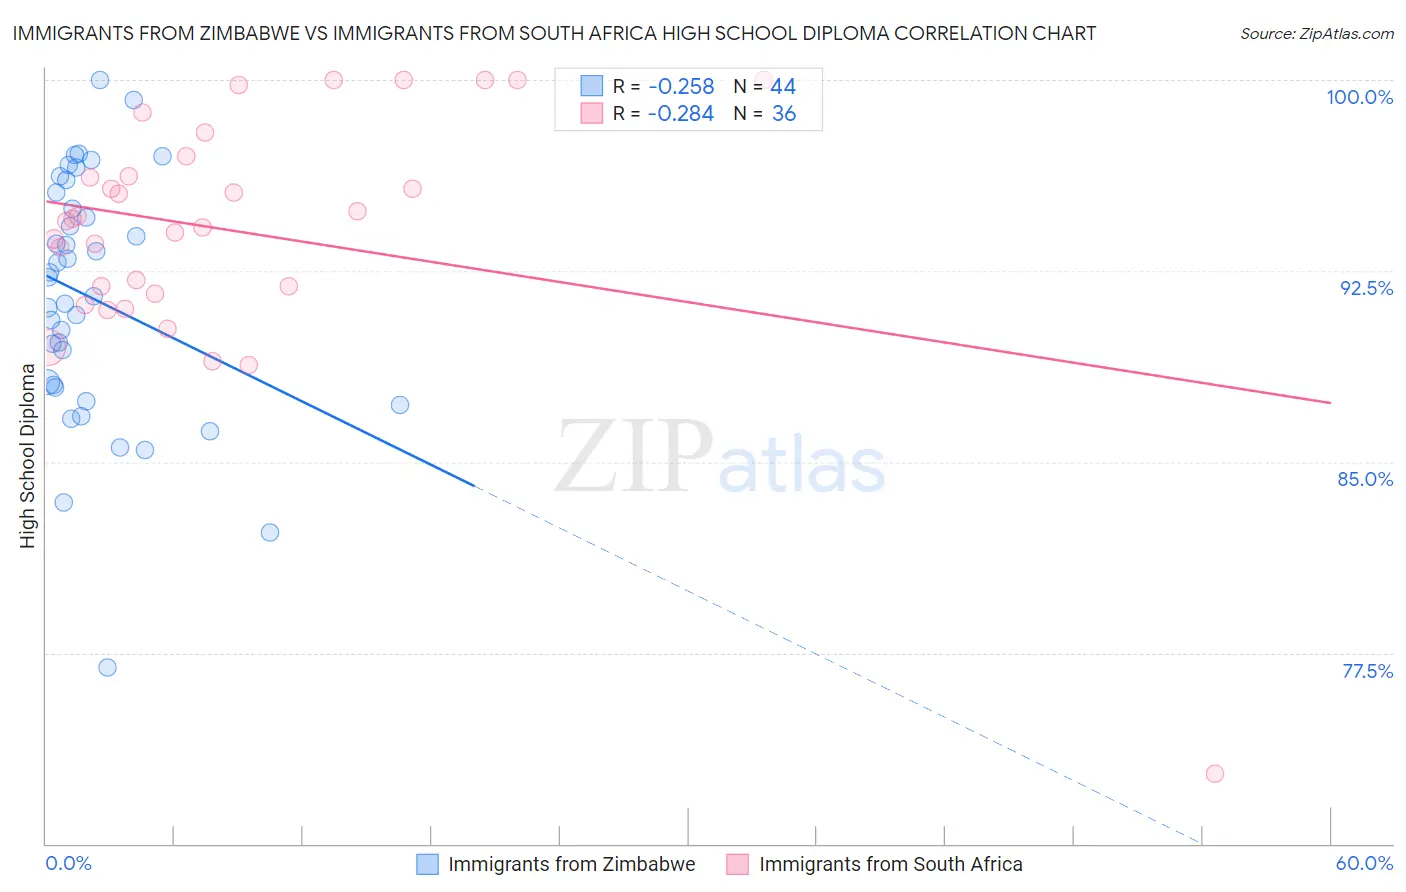
Immigrants from Zimbabwe vs Immigrants from South Africa High School Diploma Correlation Chart
The statistical analysis conducted on geographies consisting of 117,809,864 people shows a weak negative correlation between the proportion of Immigrants from Zimbabwe and percentage of population with at least high school diploma education in the United States with a correlation coefficient (R) of -0.258 and weighted average of 90.3%. Similarly, the statistical analysis conducted on geographies consisting of 233,321,693 people shows a weak negative correlation between the proportion of Immigrants from South Africa and percentage of population with at least high school diploma education in the United States with a correlation coefficient (R) of -0.284 and weighted average of 91.0%, a difference of 0.75%.
High School Diploma Correlation Summary
| Measurement | Immigrants from Zimbabwe | Immigrants from South Africa |
| Minimum | 76.9% | 72.7% |
| Maximum | 100.0% | 100.0% |
| Range | 23.1% | 27.3% |
| Mean | 91.4% | 94.1% |
| Median | 91.9% | 94.5% |
| Interquartile 25% (IQ1) | 88.0% | 91.8% |
| Interquartile 75% (IQ3) | 95.3% | 96.6% |
| Interquartile Range (IQR) | 7.3% | 4.8% |
| Standard Deviation (Sample) | 4.8% | 5.0% |
| Standard Deviation (Population) | 4.8% | 4.9% |
Similar Demographics by High School Diploma
Demographics Similar to Immigrants from Zimbabwe by High School Diploma
In terms of high school diploma, the demographic groups most similar to Immigrants from Zimbabwe are Palestinian (90.3%, a difference of 0.0%), Immigrants from Greece (90.3%, a difference of 0.010%), Menominee (90.3%, a difference of 0.010%), Immigrants from Russia (90.3%, a difference of 0.020%), and Syrian (90.3%, a difference of 0.030%).
| Demographics | Rating | Rank | High School Diploma |
| Aleuts | 98.0 /100 | #102 | Exceptional 90.4% |
| Immigrants | Romania | 97.8 /100 | #103 | Exceptional 90.4% |
| Immigrants | Croatia | 97.8 /100 | #104 | Exceptional 90.4% |
| Lebanese | 97.4 /100 | #105 | Exceptional 90.4% |
| Syrians | 97.0 /100 | #106 | Exceptional 90.3% |
| Immigrants | Russia | 96.9 /100 | #107 | Exceptional 90.3% |
| Palestinians | 96.7 /100 | #108 | Exceptional 90.3% |
| Immigrants | Zimbabwe | 96.7 /100 | #109 | Exceptional 90.3% |
| Immigrants | Greece | 96.6 /100 | #110 | Exceptional 90.3% |
| Menominee | 96.6 /100 | #111 | Exceptional 90.3% |
| Immigrants | Belarus | 96.4 /100 | #112 | Exceptional 90.2% |
| Immigrants | Sri Lanka | 96.3 /100 | #113 | Exceptional 90.2% |
| Yugoslavians | 96.2 /100 | #114 | Exceptional 90.2% |
| Immigrants | Hungary | 95.8 /100 | #115 | Exceptional 90.2% |
| Immigrants | Germany | 95.7 /100 | #116 | Exceptional 90.2% |
Demographics Similar to Immigrants from South Africa by High School Diploma
In terms of high school diploma, the demographic groups most similar to Immigrants from South Africa are Ukrainian (91.0%, a difference of 0.0%), Immigrants from Netherlands (91.0%, a difference of 0.010%), French (91.0%, a difference of 0.010%), Immigrants from Iran (90.9%, a difference of 0.030%), and Austrian (91.0%, a difference of 0.040%).
| Demographics | Rating | Rank | High School Diploma |
| Slavs | 99.7 /100 | #58 | Exceptional 91.0% |
| Immigrants | North America | 99.7 /100 | #59 | Exceptional 91.0% |
| Immigrants | Japan | 99.6 /100 | #60 | Exceptional 91.0% |
| Immigrants | Taiwan | 99.6 /100 | #61 | Exceptional 91.0% |
| Austrians | 99.6 /100 | #62 | Exceptional 91.0% |
| Immigrants | Netherlands | 99.6 /100 | #63 | Exceptional 91.0% |
| Ukrainians | 99.6 /100 | #64 | Exceptional 91.0% |
| Immigrants | South Africa | 99.6 /100 | #65 | Exceptional 91.0% |
| French | 99.5 /100 | #66 | Exceptional 91.0% |
| Immigrants | Iran | 99.5 /100 | #67 | Exceptional 90.9% |
| Czechoslovakians | 99.5 /100 | #68 | Exceptional 90.9% |
| French Canadians | 99.5 /100 | #69 | Exceptional 90.9% |
| Immigrants | Latvia | 99.5 /100 | #70 | Exceptional 90.9% |
| Alaskan Athabascans | 99.4 /100 | #71 | Exceptional 90.9% |
| Soviet Union | 99.4 /100 | #72 | Exceptional 90.9% |