Guyanese vs Immigrants from Uruguay 10th Grade

COMPARE

Guyanese
Race
Ancestry
AfghanAfricanAlaska NativeAlaskan AthabascanAlbanianAleutAlsatianAmericanApacheArabArapahoArgentineanArmenianAssyrian/Chaldean/SyriacAustralianAustrianBahamianBangladeshiBarbadianBasqueBelgianBelizeanBermudanBhutaneseBlackfeetBolivianBrazilianBritishBritish West IndianBulgarianBurmeseCajunCambodianCanadianCape VerdeanCarpatho RusynCelticCentral AmericanCentral American IndianCherokeeCheyenneChickasawChileanChineseChippewaChoctawColombianColvilleComancheCosta RicanCreeCreekCroatianCrowCubanCypriotCzechCzechoslovakianDanishDelawareDominicanDutchDutch West IndianEastern EuropeanEcuadorianEgyptianEnglishEstonianEthiopianEuropeanFijianFilipinoFinnishFrenchFrench American IndianFrench CanadianGermanGerman RussianGhanaianGreekGuamanian/ChamorroGuatemalanGuyaneseHaitianHmongHonduranHopiHoumaHungarianIcelanderIndian (Asian)IndonesianInupiatIranianIraqiIrishIroquoisIsraeliItalianJamaicanJapaneseJordanianKenyanKiowaKoreanLaotianLatvianLebaneseLiberianLithuanianLumbeeLuxembourgerMacedonianMalaysianMalteseMarshalleseMenomineeMexicanMexican American IndianMongolianMoroccanNative HawaiianNavajoNepaleseNew ZealanderNicaraguanNigerianNorthern EuropeanNorwegianOkinawanOsageOttawaPaiutePakistaniPalestinianPanamanianParaguayanPennsylvania GermanPeruvianPimaPolishPortuguesePotawatomiPuebloPuerto RicanPuget Sound SalishRomanianRussianSalvadoranSamoanScandinavianScotch-IrishScottishSeminoleSenegaleseSerbianShoshoneSierra LeoneanSiouxSlavicSlovakSloveneSomaliSouth AfricanSouth AmericanSouth American IndianSoviet UnionSpaniardSpanishSpanish AmericanSpanish American IndianSri LankanSubsaharan AfricanSudaneseSwedishSwissSyrianTaiwaneseThaiTlingit-HaidaTohono O'OdhamTonganTrinidadian and TobagonianTsimshianTurkishU.S. Virgin IslanderUgandanUkrainianUruguayanUteVenezuelanVietnameseWelshWest IndianYakamaYaquiYugoslavianYumanYup'ikZimbabwean
Immigration
NonimmigrantsImmigrantsAfghanistanAfricaAlbaniaArgentinaArmeniaAsiaAustraliaAustriaBahamasBangladeshBarbadosBelarusBelgiumBelizeBoliviaBosnia and HerzegovinaBrazilBulgariaBurma/MyanmarCabo VerdeCambodiaCameroonCanadaCaribbeanCentral AmericaChileChinaColombiaCongoCosta RicaCroatiaCubaCzechoslovakiaDenmarkDominicaDominican RepublicEastern AfricaEastern AsiaEastern EuropeEcuadorEgyptEl SalvadorEnglandEritreaEthiopiaEuropeFijiFranceGermanyGhanaGreeceGrenadaGuatemalaGuyanaHaitiHondurasHong KongHungaryIndiaIndonesiaIranIraqIrelandIsraelItalyJamaicaJapanJordanKazakhstanKenyaKoreaKuwaitLaosLatin AmericaLatviaLebanonLiberiaLithuaniaMalaysiaMexicoMicronesiaMiddle AfricaMoldovaMoroccoNepalNetherlandsNicaraguaNigeriaNorth AmericaNorth MacedoniaNorthern AfricaNorthern EuropeNorwayOceaniaPakistanPanamaPeruPhilippinesPolandPortugalRomaniaRussiaSaudi ArabiaScotlandSenegalSerbiaSierra LeoneSingaporeSomaliaSouth AfricaSouth AmericaSouth Central AsiaSouth Eastern AsiaSouthern EuropeSpainSri LankaSt. Vincent and the GrenadinesSudanSwedenSwitzerlandSyriaTaiwanThailandTrinidad and TobagoTurkeyUgandaUkraineUzbekistanVenezuelaVietnamWest IndiesWestern AfricaWestern AsiaWestern EuropeYemenZaireZimbabweAzores
Immigrants from Uruguay
Race
Ancestry
AfghanAfricanAlaska NativeAlaskan AthabascanAlbanianAleutAlsatianAmericanApacheArabArapahoArgentineanArmenianAssyrian/Chaldean/SyriacAustralianAustrianBahamianBangladeshiBarbadianBasqueBelgianBelizeanBermudanBhutaneseBlackfeetBolivianBrazilianBritishBritish West IndianBulgarianBurmeseCajunCambodianCanadianCape VerdeanCarpatho RusynCelticCentral AmericanCentral American IndianCherokeeCheyenneChickasawChileanChineseChippewaChoctawColombianColvilleComancheCosta RicanCreeCreekCroatianCrowCubanCypriotCzechCzechoslovakianDanishDelawareDominicanDutchDutch West IndianEastern EuropeanEcuadorianEgyptianEnglishEstonianEthiopianEuropeanFijianFilipinoFinnishFrenchFrench American IndianFrench CanadianGermanGerman RussianGhanaianGreekGuamanian/ChamorroGuatemalanHaitianHmongHonduranHopiHoumaHungarianIcelanderIndian (Asian)IndonesianInupiatIranianIraqiIrishIroquoisIsraeliItalianJamaicanJapaneseJordanianKenyanKiowaKoreanLaotianLatvianLebaneseLiberianLithuanianLumbeeLuxembourgerMacedonianMalaysianMalteseMarshalleseMenomineeMexicanMexican American IndianMongolianMoroccanNative HawaiianNavajoNepaleseNew ZealanderNicaraguanNigerianNorthern EuropeanNorwegianOkinawanOsageOttawaPaiutePakistaniPalestinianPanamanianParaguayanPennsylvania GermanPeruvianPimaPolishPortuguesePotawatomiPuebloPuerto RicanPuget Sound SalishRomanianRussianSalvadoranSamoanScandinavianScotch-IrishScottishSeminoleSenegaleseSerbianShoshoneSierra LeoneanSiouxSlavicSlovakSloveneSomaliSouth AfricanSouth AmericanSouth American IndianSoviet UnionSpaniardSpanishSpanish AmericanSpanish American IndianSri LankanSubsaharan AfricanSudaneseSwedishSwissSyrianTaiwaneseThaiTlingit-HaidaTohono O'OdhamTonganTrinidadian and TobagonianTsimshianTurkishU.S. Virgin IslanderUgandanUkrainianUruguayanUteVenezuelanVietnameseWelshWest IndianYakamaYaquiYugoslavianYumanYup'ikZimbabwean
Immigration
NonimmigrantsImmigrantsAfghanistanAfricaAlbaniaArgentinaArmeniaAsiaAustraliaAustriaBahamasBangladeshBarbadosBelarusBelgiumBelizeBoliviaBosnia and HerzegovinaBrazilBulgariaBurma/MyanmarCabo VerdeCambodiaCameroonCanadaCaribbeanCentral AmericaChileChinaColombiaCongoCosta RicaCroatiaCubaCzechoslovakiaDenmarkDominicaDominican RepublicEastern AfricaEastern AsiaEastern EuropeEcuadorEgyptEl SalvadorEnglandEritreaEthiopiaEuropeFijiFranceGermanyGhanaGreeceGrenadaGuatemalaGuyanaHaitiHondurasHong KongHungaryIndiaIndonesiaIranIraqIrelandIsraelItalyJamaicaJapanJordanKazakhstanKenyaKoreaKuwaitLaosLatin AmericaLatviaLebanonLiberiaLithuaniaMalaysiaMexicoMicronesiaMiddle AfricaMoldovaMoroccoNepalNetherlandsNicaraguaNigeriaNorth AmericaNorth MacedoniaNorthern AfricaNorthern EuropeNorwayOceaniaPakistanPanamaPeruPhilippinesPolandPortugalRomaniaRussiaSaudi ArabiaScotlandSenegalSerbiaSierra LeoneSingaporeSomaliaSouth AfricaSouth AmericaSouth Central AsiaSouth Eastern AsiaSouthern EuropeSpainSri LankaSt. Vincent and the GrenadinesSudanSwedenSwitzerlandSyriaTaiwanThailandTrinidad and TobagoTurkeyUgandaUkraineUruguayUzbekistanVenezuelaVietnamWest IndiesWestern AfricaWestern AsiaWestern EuropeYemenZaireZimbabweAzores
10th Grade
Income
Poverty
Unemployment
Labor Participation
Family Structure
Vehicle Availability
Education Level
Disability

10th Grade Comparison

Guyanese

Immigrants from Uruguay

Tragic
Tragic
91.4%
10TH GRADE
0.0/ 100
METRIC RATING
300th/ 347
METRIC RANK
92.5%
10TH GRADE
0.3/ 100
METRIC RATING
270th/ 347
METRIC RANK

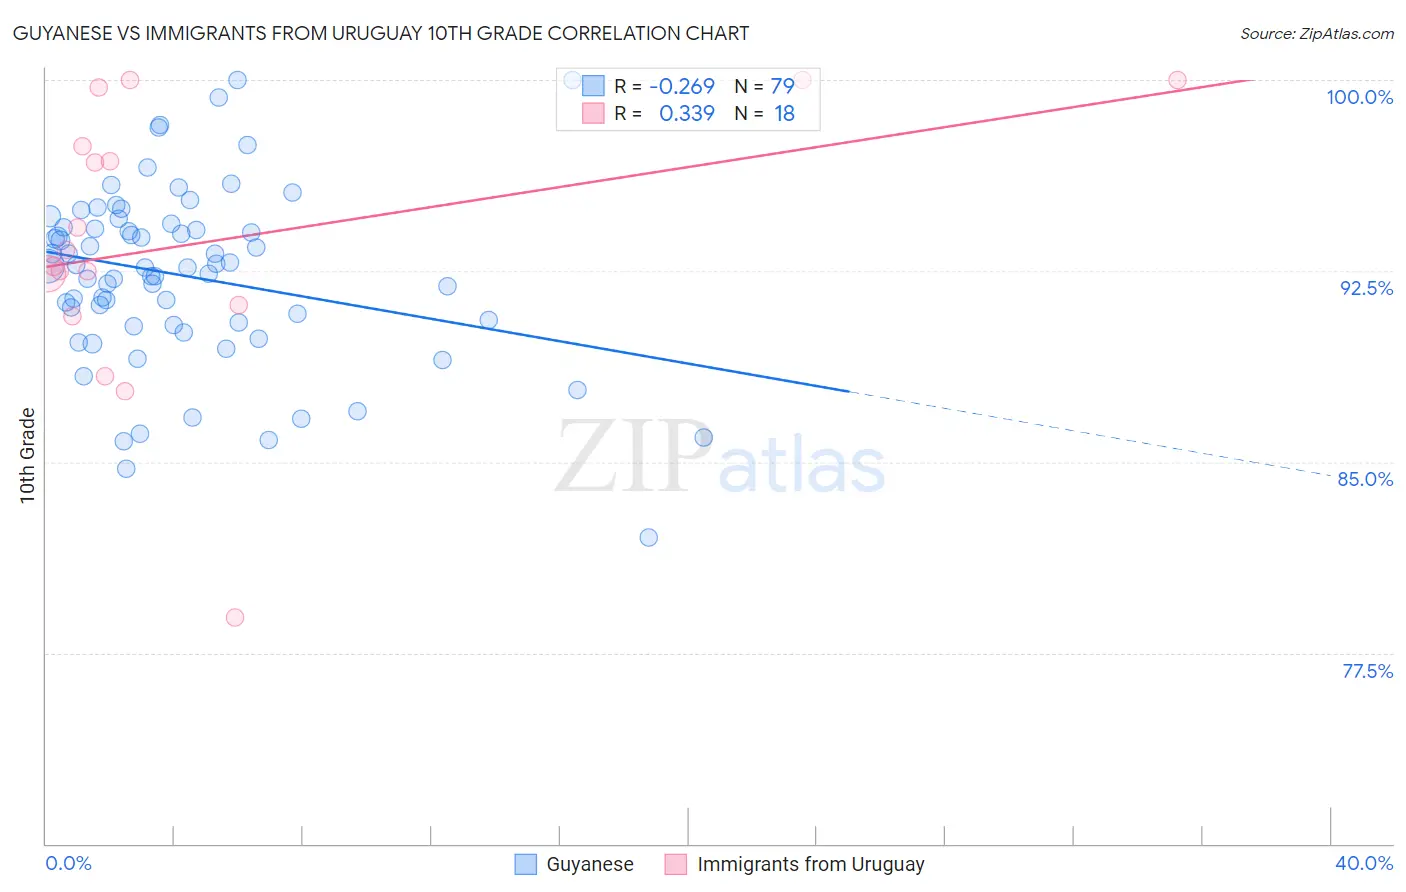
Guyanese vs Immigrants from Uruguay 10th Grade Correlation Chart

The statistical analysis conducted on geographies consisting of 176,937,226 people shows a weak negative correlation between the proportion of Guyanese and percentage of population with at least 10th grade education in the United States with a correlation coefficient (R) of -0.269 and weighted average of 91.4%. Similarly, the statistical analysis conducted on geographies consisting of 133,259,667 people shows a mild positive correlation between the proportion of Immigrants from Uruguay and percentage of population with at least 10th grade education in the United States with a correlation coefficient (R) of 0.339 and weighted average of 92.5%, a difference of 1.3%.
Guyanese vs Immigrants from Uruguay 10th Grade

10th Grade Correlation Summary

MeasurementGuyaneseImmigrants from Uruguay
Minimum82.0%78.9%
Maximum100.0%100.0%
Range18.0%21.1%
Mean92.3%93.6%
Median92.6%93.0%
Interquartile 25% (IQ1)90.4%91.2%
Interquartile 75% (IQ3)94.2%97.4%
Interquartile Range (IQR)3.8%6.2%
Standard Deviation (Sample)3.5%5.4%
Standard Deviation (Population)3.5%5.2%

Similar Demographics by 10th Grade

Demographics Similar to Guyanese by 10th Grade

In terms of 10th grade, the demographic groups most similar to Guyanese are Immigrants from Haiti (91.4%, a difference of 0.050%), Cuban (91.5%, a difference of 0.12%), Fijian (91.5%, a difference of 0.15%), Japanese (91.2%, a difference of 0.15%), and Immigrants from Guyana (91.2%, a difference of 0.16%).
DemographicsRating | Rank10th Grade
Indonesians
0.0
/100
|
#293
Tragic
91.8%
Haitians
0.0
/100
|
#294
Tragic
91.8%
Lumbee
0.0
/100
|
#295
Tragic
91.7%
Immigrants | Grenada
0.0
/100
|
#296
Tragic
91.6%
Fijians
0.0
/100
|
#297
Tragic
91.5%
Cubans
0.0
/100
|
#298
Tragic
91.5%
Immigrants | Haiti
0.0
/100
|
#299
Tragic
91.4%
Guyanese
0.0
/100
|
#300
Tragic
91.4%
Japanese
0.0
/100
|
#301
Tragic
91.2%
Immigrants | Guyana
0.0
/100
|
#302
Tragic
91.2%
Immigrants | Vietnam
0.0
/100
|
#303
Tragic
91.2%
Pima
0.0
/100
|
#304
Tragic
91.2%
Immigrants | Dominica
0.0
/100
|
#305
Tragic
91.1%
Yaqui
0.0
/100
|
#306
Tragic
91.1%
Immigrants | Fiji
0.0
/100
|
#307
Tragic
91.0%

Demographics Similar to Immigrants from Uruguay by 10th Grade

In terms of 10th grade, the demographic groups most similar to Immigrants from Uruguay are Immigrants from Colombia (92.5%, a difference of 0.0%), Immigrants from Eritrea (92.5%, a difference of 0.010%), Taiwanese (92.5%, a difference of 0.020%), Immigrants from Ghana (92.5%, a difference of 0.020%), and Immigrants from Western Africa (92.5%, a difference of 0.020%).
DemographicsRating | Rank10th Grade
Apache
0.4
/100
|
#263
Tragic
92.6%
Peruvians
0.4
/100
|
#264
Tragic
92.6%
Dutch West Indians
0.4
/100
|
#265
Tragic
92.6%
Immigrants | Philippines
0.4
/100
|
#266
Tragic
92.6%
Taiwanese
0.3
/100
|
#267
Tragic
92.5%
Immigrants | Ghana
0.3
/100
|
#268
Tragic
92.5%
Immigrants | Colombia
0.3
/100
|
#269
Tragic
92.5%
Immigrants | Uruguay
0.3
/100
|
#270
Tragic
92.5%
Immigrants | Eritrea
0.3
/100
|
#271
Tragic
92.5%
Immigrants | Western Africa
0.3
/100
|
#272
Tragic
92.5%
Trinidadians and Tobagonians
0.2
/100
|
#273
Tragic
92.4%
Immigrants | Congo
0.2
/100
|
#274
Tragic
92.4%
West Indians
0.2
/100
|
#275
Tragic
92.4%
Immigrants | Trinidad and Tobago
0.1
/100
|
#276
Tragic
92.3%
Navajo
0.1
/100
|
#277
Tragic
92.3%