Guyanese vs Immigrants from Nicaragua 10th Grade
COMPARE
Guyanese
Immigrants from Nicaragua
10th Grade
10th Grade Comparison
Guyanese
Immigrants from Nicaragua
91.4%
10TH GRADE
0.0/ 100
METRIC RATING
300th/ 347
METRIC RANK
89.5%
10TH GRADE
0.0/ 100
METRIC RATING
327th/ 347
METRIC RANK
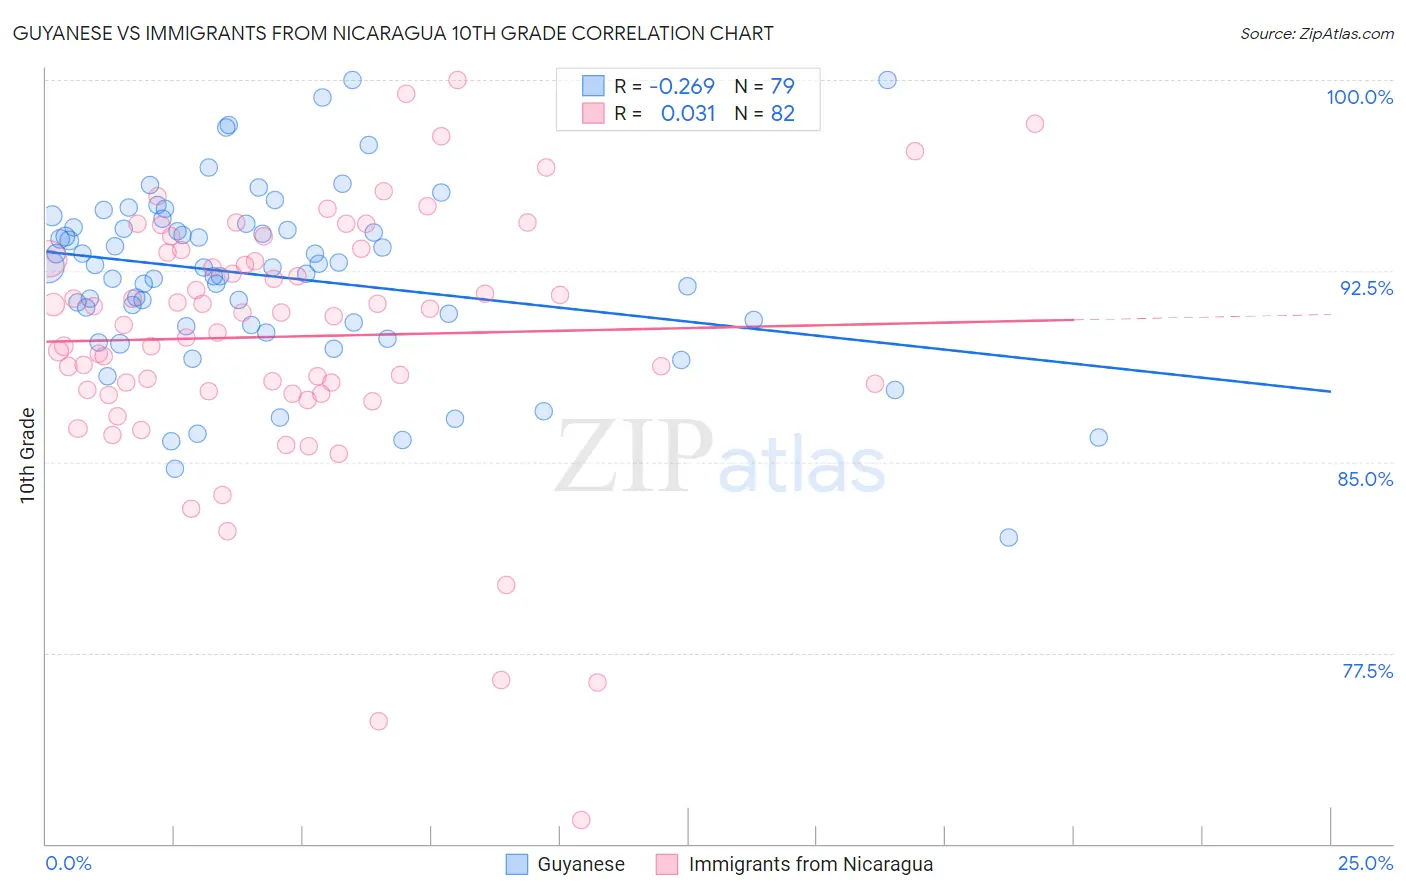
Guyanese vs Immigrants from Nicaragua 10th Grade Correlation Chart
The statistical analysis conducted on geographies consisting of 176,937,226 people shows a weak negative correlation between the proportion of Guyanese and percentage of population with at least 10th grade education in the United States with a correlation coefficient (R) of -0.269 and weighted average of 91.4%. Similarly, the statistical analysis conducted on geographies consisting of 236,340,506 people shows no correlation between the proportion of Immigrants from Nicaragua and percentage of population with at least 10th grade education in the United States with a correlation coefficient (R) of 0.031 and weighted average of 89.5%, a difference of 2.1%.
10th Grade Correlation Summary
| Measurement | Guyanese | Immigrants from Nicaragua |
| Minimum | 82.0% | 70.9% |
| Maximum | 100.0% | 100.0% |
| Range | 18.0% | 29.1% |
| Mean | 92.3% | 89.9% |
| Median | 92.6% | 90.8% |
| Interquartile 25% (IQ1) | 90.4% | 87.8% |
| Interquartile 75% (IQ3) | 94.2% | 93.2% |
| Interquartile Range (IQR) | 3.8% | 5.4% |
| Standard Deviation (Sample) | 3.5% | 5.2% |
| Standard Deviation (Population) | 3.5% | 5.1% |
Similar Demographics by 10th Grade
Demographics Similar to Guyanese by 10th Grade
In terms of 10th grade, the demographic groups most similar to Guyanese are Immigrants from Haiti (91.4%, a difference of 0.050%), Cuban (91.5%, a difference of 0.12%), Fijian (91.5%, a difference of 0.15%), Japanese (91.2%, a difference of 0.15%), and Immigrants from Guyana (91.2%, a difference of 0.16%).
| Demographics | Rating | Rank | 10th Grade |
| Indonesians | 0.0 /100 | #293 | Tragic 91.8% |
| Haitians | 0.0 /100 | #294 | Tragic 91.8% |
| Lumbee | 0.0 /100 | #295 | Tragic 91.7% |
| Immigrants | Grenada | 0.0 /100 | #296 | Tragic 91.6% |
| Fijians | 0.0 /100 | #297 | Tragic 91.5% |
| Cubans | 0.0 /100 | #298 | Tragic 91.5% |
| Immigrants | Haiti | 0.0 /100 | #299 | Tragic 91.4% |
| Guyanese | 0.0 /100 | #300 | Tragic 91.4% |
| Japanese | 0.0 /100 | #301 | Tragic 91.2% |
| Immigrants | Guyana | 0.0 /100 | #302 | Tragic 91.2% |
| Immigrants | Vietnam | 0.0 /100 | #303 | Tragic 91.2% |
| Pima | 0.0 /100 | #304 | Tragic 91.2% |
| Immigrants | Dominica | 0.0 /100 | #305 | Tragic 91.1% |
| Yaqui | 0.0 /100 | #306 | Tragic 91.1% |
| Immigrants | Fiji | 0.0 /100 | #307 | Tragic 91.0% |
Demographics Similar to Immigrants from Nicaragua by 10th Grade
In terms of 10th grade, the demographic groups most similar to Immigrants from Nicaragua are Immigrants from Cabo Verde (89.5%, a difference of 0.010%), Dominican (89.4%, a difference of 0.11%), Central American Indian (89.7%, a difference of 0.26%), Puerto Rican (89.8%, a difference of 0.43%), and Immigrants from Armenia (89.9%, a difference of 0.46%).
| Demographics | Rating | Rank | 10th Grade |
| Houma | 0.0 /100 | #320 | Tragic 90.2% |
| Belizeans | 0.0 /100 | #321 | Tragic 90.2% |
| Tohono O'odham | 0.0 /100 | #322 | Tragic 90.1% |
| Immigrants | Belize | 0.0 /100 | #323 | Tragic 90.1% |
| Immigrants | Armenia | 0.0 /100 | #324 | Tragic 89.9% |
| Puerto Ricans | 0.0 /100 | #325 | Tragic 89.8% |
| Central American Indians | 0.0 /100 | #326 | Tragic 89.7% |
| Immigrants | Nicaragua | 0.0 /100 | #327 | Tragic 89.5% |
| Immigrants | Cabo Verde | 0.0 /100 | #328 | Tragic 89.5% |
| Dominicans | 0.0 /100 | #329 | Tragic 89.4% |
| Immigrants | Yemen | 0.0 /100 | #330 | Tragic 89.1% |
| Mexican American Indians | 0.0 /100 | #331 | Tragic 89.0% |
| Immigrants | Azores | 0.0 /100 | #332 | Tragic 89.0% |
| Hondurans | 0.0 /100 | #333 | Tragic 89.0% |
| Hispanics or Latinos | 0.0 /100 | #334 | Tragic 88.9% |