Guyanese vs Immigrants from Taiwan Doctorate Degree
COMPARE
Guyanese
Immigrants from Taiwan
Doctorate Degree
Doctorate Degree Comparison
Guyanese
Immigrants from Taiwan
1.4%
DOCTORATE DEGREE
0.1/ 100
METRIC RATING
306th/ 347
METRIC RANK
3.2%
DOCTORATE DEGREE
100.0/ 100
METRIC RATING
4th/ 347
METRIC RANK
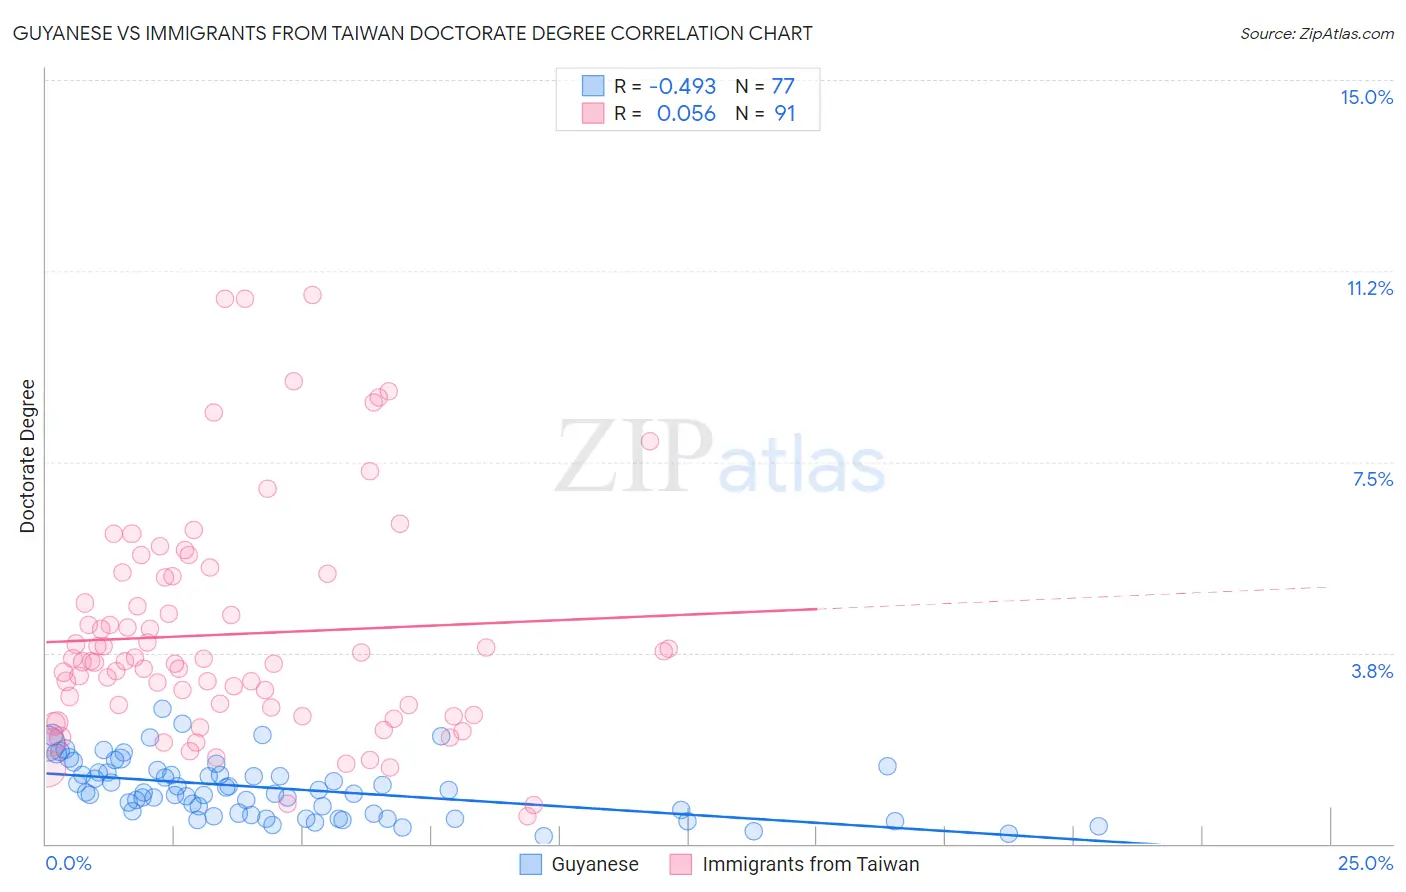
Guyanese vs Immigrants from Taiwan Doctorate Degree Correlation Chart
The statistical analysis conducted on geographies consisting of 176,288,102 people shows a moderate negative correlation between the proportion of Guyanese and percentage of population with at least doctorate degree education in the United States with a correlation coefficient (R) of -0.493 and weighted average of 1.4%. Similarly, the statistical analysis conducted on geographies consisting of 297,175,735 people shows a slight positive correlation between the proportion of Immigrants from Taiwan and percentage of population with at least doctorate degree education in the United States with a correlation coefficient (R) of 0.056 and weighted average of 3.2%, a difference of 131.6%.
Doctorate Degree Correlation Summary
| Measurement | Guyanese | Immigrants from Taiwan |
| Minimum | 0.14% | 0.55% |
| Maximum | 2.6% | 10.8% |
| Range | 2.5% | 10.2% |
| Mean | 1.1% | 4.1% |
| Median | 1.0% | 3.6% |
| Interquartile 25% (IQ1) | 0.59% | 2.5% |
| Interquartile 75% (IQ3) | 1.4% | 5.3% |
| Interquartile Range (IQR) | 0.83% | 2.7% |
| Standard Deviation (Sample) | 0.57% | 2.2% |
| Standard Deviation (Population) | 0.56% | 2.2% |
Similar Demographics by Doctorate Degree
Demographics Similar to Guyanese by Doctorate Degree
In terms of doctorate degree, the demographic groups most similar to Guyanese are Pennsylvania German (1.4%, a difference of 0.010%), Mexican American Indian (1.4%, a difference of 0.15%), Immigrants from Dominica (1.4%, a difference of 0.20%), Shoshone (1.4%, a difference of 0.23%), and Cuban (1.4%, a difference of 0.25%).
| Demographics | Rating | Rank | Doctorate Degree |
| Belizeans | 0.1 /100 | #299 | Tragic 1.4% |
| Immigrants | Guatemala | 0.1 /100 | #300 | Tragic 1.4% |
| Hondurans | 0.1 /100 | #301 | Tragic 1.4% |
| Shoshone | 0.1 /100 | #302 | Tragic 1.4% |
| Immigrants | Dominica | 0.1 /100 | #303 | Tragic 1.4% |
| Mexican American Indians | 0.1 /100 | #304 | Tragic 1.4% |
| Pennsylvania Germans | 0.1 /100 | #305 | Tragic 1.4% |
| Guyanese | 0.1 /100 | #306 | Tragic 1.4% |
| Cubans | 0.1 /100 | #307 | Tragic 1.4% |
| Immigrants | Laos | 0.1 /100 | #308 | Tragic 1.4% |
| Immigrants | Grenada | 0.1 /100 | #309 | Tragic 1.4% |
| Immigrants | Jamaica | 0.1 /100 | #310 | Tragic 1.4% |
| Immigrants | Honduras | 0.1 /100 | #311 | Tragic 1.4% |
| Immigrants | Nicaragua | 0.1 /100 | #312 | Tragic 1.4% |
| Menominee | 0.1 /100 | #313 | Tragic 1.4% |
Demographics Similar to Immigrants from Taiwan by Doctorate Degree
In terms of doctorate degree, the demographic groups most similar to Immigrants from Taiwan are Iranian (3.1%, a difference of 1.5%), Okinawan (3.3%, a difference of 2.6%), Immigrants from Switzerland (3.1%, a difference of 3.5%), Immigrants from China (3.1%, a difference of 3.6%), and Immigrants from Israel (3.0%, a difference of 4.9%).
| Demographics | Rating | Rank | Doctorate Degree |
| Immigrants | Singapore | 100.0 /100 | #1 | Exceptional 3.7% |
| Filipinos | 100.0 /100 | #2 | Exceptional 3.4% |
| Okinawans | 100.0 /100 | #3 | Exceptional 3.3% |
| Immigrants | Taiwan | 100.0 /100 | #4 | Exceptional 3.2% |
| Iranians | 100.0 /100 | #5 | Exceptional 3.1% |
| Immigrants | Switzerland | 100.0 /100 | #6 | Exceptional 3.1% |
| Immigrants | China | 100.0 /100 | #7 | Exceptional 3.1% |
| Immigrants | Israel | 100.0 /100 | #8 | Exceptional 3.0% |
| Immigrants | Iran | 100.0 /100 | #9 | Exceptional 3.0% |
| Immigrants | Eastern Asia | 100.0 /100 | #10 | Exceptional 3.0% |
| Indians (Asian) | 100.0 /100 | #11 | Exceptional 2.9% |
| Immigrants | Belgium | 100.0 /100 | #12 | Exceptional 2.9% |
| Immigrants | Sweden | 100.0 /100 | #13 | Exceptional 2.9% |
| Immigrants | France | 100.0 /100 | #14 | Exceptional 2.9% |
| Immigrants | India | 100.0 /100 | #15 | Exceptional 2.8% |