Guyanese vs French Canadian Doctorate Degree
COMPARE
Guyanese
French Canadian
Doctorate Degree
Doctorate Degree Comparison
Guyanese
French Canadians
1.4%
DOCTORATE DEGREE
0.1/ 100
METRIC RATING
306th/ 347
METRIC RANK
1.8%
DOCTORATE DEGREE
30.2/ 100
METRIC RATING
189th/ 347
METRIC RANK
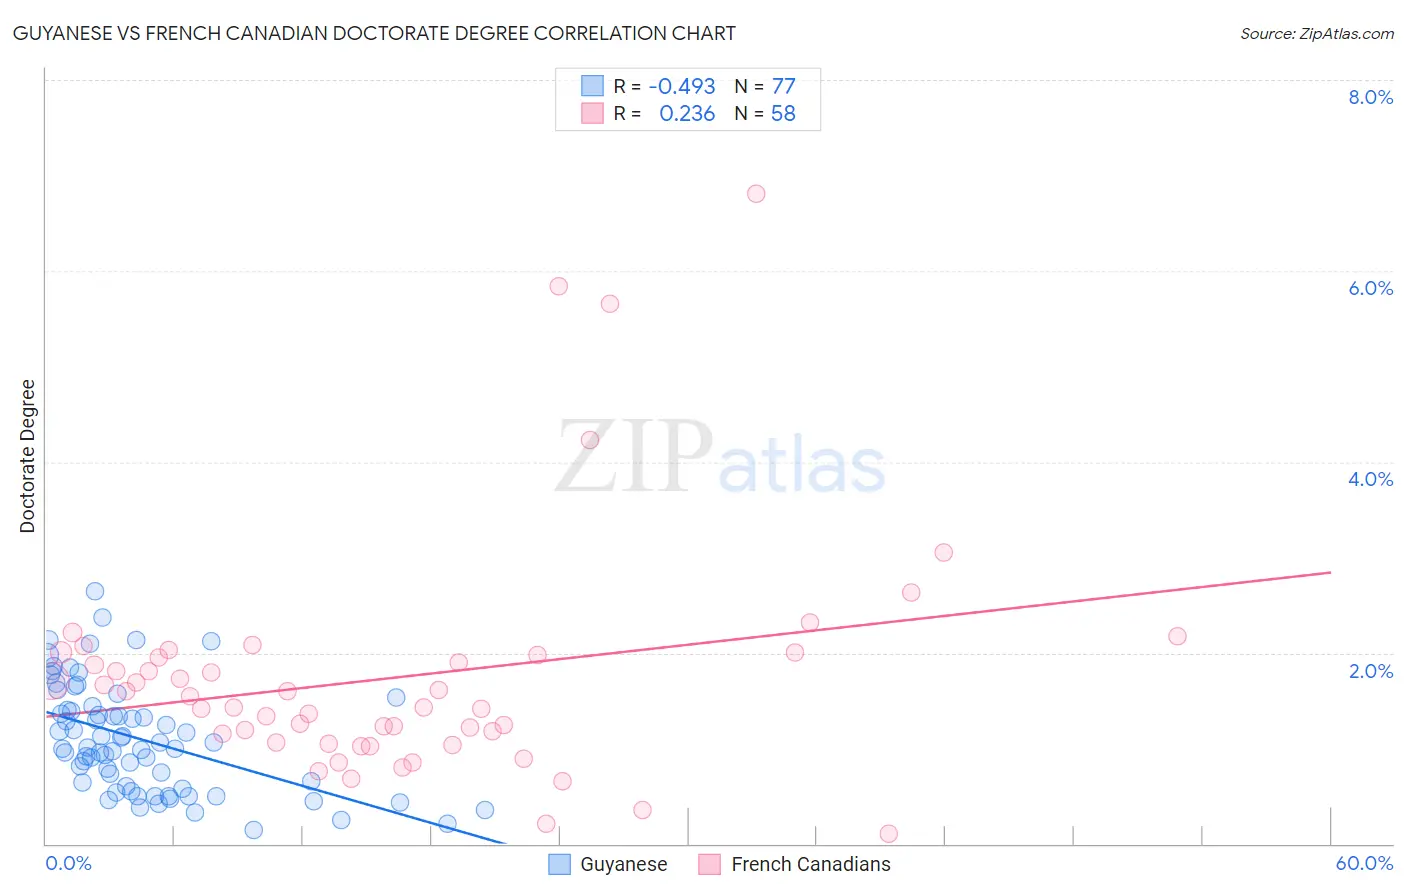
Guyanese vs French Canadian Doctorate Degree Correlation Chart
The statistical analysis conducted on geographies consisting of 176,288,102 people shows a moderate negative correlation between the proportion of Guyanese and percentage of population with at least doctorate degree education in the United States with a correlation coefficient (R) of -0.493 and weighted average of 1.4%. Similarly, the statistical analysis conducted on geographies consisting of 490,873,037 people shows a weak positive correlation between the proportion of French Canadians and percentage of population with at least doctorate degree education in the United States with a correlation coefficient (R) of 0.236 and weighted average of 1.8%, a difference of 29.1%.
Doctorate Degree Correlation Summary
| Measurement | Guyanese | French Canadian |
| Minimum | 0.14% | 0.11% |
| Maximum | 2.6% | 6.8% |
| Range | 2.5% | 6.7% |
| Mean | 1.1% | 1.7% |
| Median | 1.0% | 1.5% |
| Interquartile 25% (IQ1) | 0.59% | 1.1% |
| Interquartile 75% (IQ3) | 1.4% | 2.0% |
| Interquartile Range (IQR) | 0.83% | 0.92% |
| Standard Deviation (Sample) | 0.57% | 1.2% |
| Standard Deviation (Population) | 0.56% | 1.2% |
Similar Demographics by Doctorate Degree
Demographics Similar to Guyanese by Doctorate Degree
In terms of doctorate degree, the demographic groups most similar to Guyanese are Pennsylvania German (1.4%, a difference of 0.010%), Mexican American Indian (1.4%, a difference of 0.15%), Immigrants from Dominica (1.4%, a difference of 0.20%), Shoshone (1.4%, a difference of 0.23%), and Cuban (1.4%, a difference of 0.25%).
| Demographics | Rating | Rank | Doctorate Degree |
| Belizeans | 0.1 /100 | #299 | Tragic 1.4% |
| Immigrants | Guatemala | 0.1 /100 | #300 | Tragic 1.4% |
| Hondurans | 0.1 /100 | #301 | Tragic 1.4% |
| Shoshone | 0.1 /100 | #302 | Tragic 1.4% |
| Immigrants | Dominica | 0.1 /100 | #303 | Tragic 1.4% |
| Mexican American Indians | 0.1 /100 | #304 | Tragic 1.4% |
| Pennsylvania Germans | 0.1 /100 | #305 | Tragic 1.4% |
| Guyanese | 0.1 /100 | #306 | Tragic 1.4% |
| Cubans | 0.1 /100 | #307 | Tragic 1.4% |
| Immigrants | Laos | 0.1 /100 | #308 | Tragic 1.4% |
| Immigrants | Grenada | 0.1 /100 | #309 | Tragic 1.4% |
| Immigrants | Jamaica | 0.1 /100 | #310 | Tragic 1.4% |
| Immigrants | Honduras | 0.1 /100 | #311 | Tragic 1.4% |
| Immigrants | Nicaragua | 0.1 /100 | #312 | Tragic 1.4% |
| Menominee | 0.1 /100 | #313 | Tragic 1.4% |
Demographics Similar to French Canadians by Doctorate Degree
In terms of doctorate degree, the demographic groups most similar to French Canadians are Immigrants from Costa Rica (1.8%, a difference of 0.020%), German (1.8%, a difference of 0.040%), South American (1.8%, a difference of 0.13%), Czechoslovakian (1.8%, a difference of 0.49%), and Dutch (1.8%, a difference of 0.52%).
| Demographics | Rating | Rank | Doctorate Degree |
| Immigrants | Afghanistan | 44.3 /100 | #182 | Average 1.8% |
| Finns | 42.1 /100 | #183 | Average 1.8% |
| Nigerians | 39.9 /100 | #184 | Fair 1.8% |
| Slovaks | 36.4 /100 | #185 | Fair 1.8% |
| Peruvians | 34.4 /100 | #186 | Fair 1.8% |
| Czechoslovakians | 33.0 /100 | #187 | Fair 1.8% |
| Germans | 30.5 /100 | #188 | Fair 1.8% |
| French Canadians | 30.2 /100 | #189 | Fair 1.8% |
| Immigrants | Costa Rica | 30.2 /100 | #190 | Fair 1.8% |
| South Americans | 29.5 /100 | #191 | Fair 1.8% |
| Dutch | 27.4 /100 | #192 | Fair 1.8% |
| German Russians | 27.1 /100 | #193 | Fair 1.8% |
| Uruguayans | 26.2 /100 | #194 | Fair 1.8% |
| Immigrants | Somalia | 25.4 /100 | #195 | Fair 1.8% |
| Sub-Saharan Africans | 25.1 /100 | #196 | Fair 1.8% |