Guyanese vs Spaniard Doctorate Degree
COMPARE
Guyanese
Spaniard
Doctorate Degree
Doctorate Degree Comparison
Guyanese
Spaniards
1.4%
DOCTORATE DEGREE
0.1/ 100
METRIC RATING
306th/ 347
METRIC RANK
1.9%
DOCTORATE DEGREE
63.5/ 100
METRIC RATING
166th/ 347
METRIC RANK
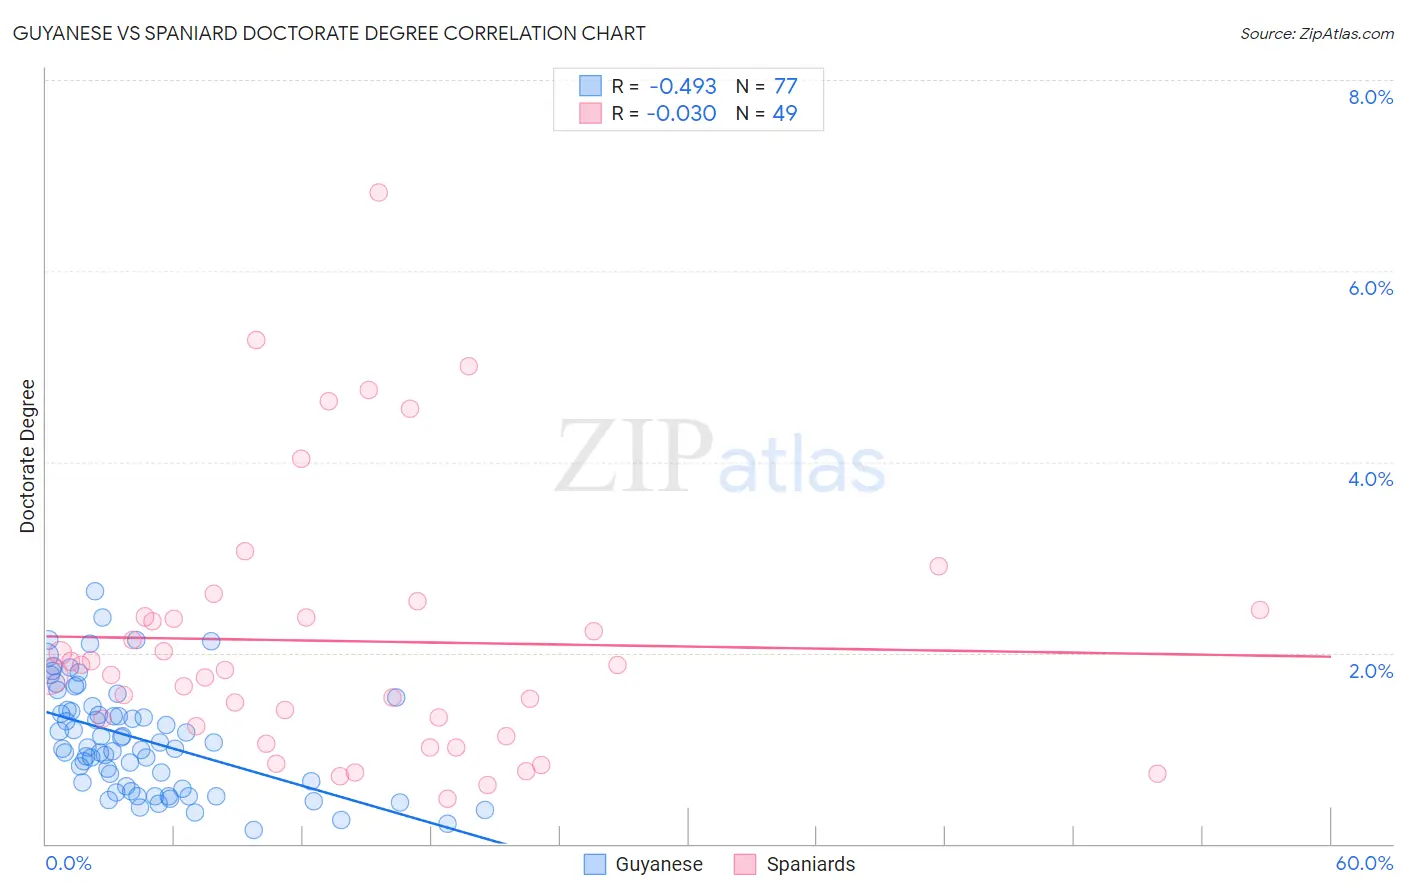
Guyanese vs Spaniard Doctorate Degree Correlation Chart
The statistical analysis conducted on geographies consisting of 176,288,102 people shows a moderate negative correlation between the proportion of Guyanese and percentage of population with at least doctorate degree education in the United States with a correlation coefficient (R) of -0.493 and weighted average of 1.4%. Similarly, the statistical analysis conducted on geographies consisting of 436,775,584 people shows no correlation between the proportion of Spaniards and percentage of population with at least doctorate degree education in the United States with a correlation coefficient (R) of -0.030 and weighted average of 1.9%, a difference of 35.9%.
Doctorate Degree Correlation Summary
| Measurement | Guyanese | Spaniard |
| Minimum | 0.14% | 0.47% |
| Maximum | 2.6% | 6.8% |
| Range | 2.5% | 6.3% |
| Mean | 1.1% | 2.1% |
| Median | 1.0% | 1.8% |
| Interquartile 25% (IQ1) | 0.59% | 1.2% |
| Interquartile 75% (IQ3) | 1.4% | 2.4% |
| Interquartile Range (IQR) | 0.83% | 1.2% |
| Standard Deviation (Sample) | 0.57% | 1.4% |
| Standard Deviation (Population) | 0.56% | 1.4% |
Similar Demographics by Doctorate Degree
Demographics Similar to Guyanese by Doctorate Degree
In terms of doctorate degree, the demographic groups most similar to Guyanese are Pennsylvania German (1.4%, a difference of 0.010%), Mexican American Indian (1.4%, a difference of 0.15%), Immigrants from Dominica (1.4%, a difference of 0.20%), Shoshone (1.4%, a difference of 0.23%), and Cuban (1.4%, a difference of 0.25%).
| Demographics | Rating | Rank | Doctorate Degree |
| Belizeans | 0.1 /100 | #299 | Tragic 1.4% |
| Immigrants | Guatemala | 0.1 /100 | #300 | Tragic 1.4% |
| Hondurans | 0.1 /100 | #301 | Tragic 1.4% |
| Shoshone | 0.1 /100 | #302 | Tragic 1.4% |
| Immigrants | Dominica | 0.1 /100 | #303 | Tragic 1.4% |
| Mexican American Indians | 0.1 /100 | #304 | Tragic 1.4% |
| Pennsylvania Germans | 0.1 /100 | #305 | Tragic 1.4% |
| Guyanese | 0.1 /100 | #306 | Tragic 1.4% |
| Cubans | 0.1 /100 | #307 | Tragic 1.4% |
| Immigrants | Laos | 0.1 /100 | #308 | Tragic 1.4% |
| Immigrants | Grenada | 0.1 /100 | #309 | Tragic 1.4% |
| Immigrants | Jamaica | 0.1 /100 | #310 | Tragic 1.4% |
| Immigrants | Honduras | 0.1 /100 | #311 | Tragic 1.4% |
| Immigrants | Nicaragua | 0.1 /100 | #312 | Tragic 1.4% |
| Menominee | 0.1 /100 | #313 | Tragic 1.4% |
Demographics Similar to Spaniards by Doctorate Degree
In terms of doctorate degree, the demographic groups most similar to Spaniards are Scotch-Irish (1.9%, a difference of 0.020%), Macedonian (1.9%, a difference of 0.39%), Sri Lankan (1.9%, a difference of 0.49%), Celtic (1.9%, a difference of 0.50%), and Czech (1.9%, a difference of 0.60%).
| Demographics | Rating | Rank | Doctorate Degree |
| Slovenes | 70.2 /100 | #159 | Good 1.9% |
| Welsh | 69.7 /100 | #160 | Good 1.9% |
| Immigrants | Middle Africa | 68.8 /100 | #161 | Good 1.9% |
| Irish | 67.5 /100 | #162 | Good 1.9% |
| Czechs | 67.3 /100 | #163 | Good 1.9% |
| Celtics | 66.7 /100 | #164 | Good 1.9% |
| Scotch-Irish | 63.6 /100 | #165 | Good 1.9% |
| Spaniards | 63.5 /100 | #166 | Good 1.9% |
| Macedonians | 60.9 /100 | #167 | Good 1.9% |
| Sri Lankans | 60.3 /100 | #168 | Good 1.9% |
| Vietnamese | 54.8 /100 | #169 | Average 1.9% |
| Costa Ricans | 53.3 /100 | #170 | Average 1.8% |
| Bermudans | 52.1 /100 | #171 | Average 1.8% |
| Belgians | 50.3 /100 | #172 | Average 1.8% |
| Norwegians | 50.0 /100 | #173 | Average 1.8% |