Guatemalan vs Sierra Leonean Nursery School
COMPARE
Guatemalan
Sierra Leonean
Nursery School
Nursery School Comparison
Guatemalans
Sierra Leoneans
96.6%
NURSERY SCHOOL
0.0/ 100
METRIC RATING
336th/ 347
METRIC RANK
97.7%
NURSERY SCHOOL
2.9/ 100
METRIC RATING
230th/ 347
METRIC RANK
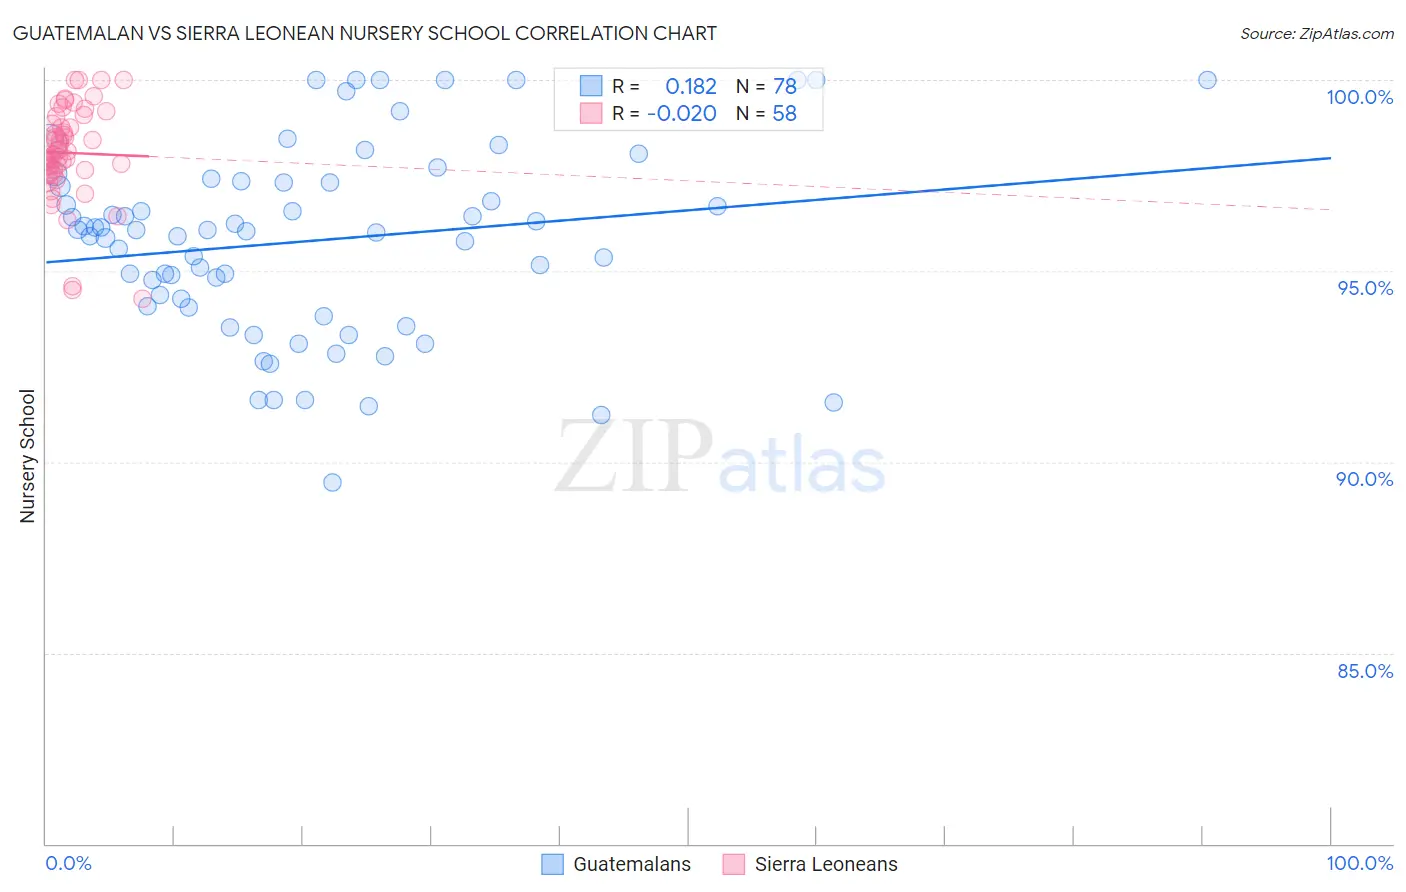
Guatemalan vs Sierra Leonean Nursery School Correlation Chart
The statistical analysis conducted on geographies consisting of 409,566,469 people shows a poor positive correlation between the proportion of Guatemalans and percentage of population with at least nursery school education in the United States with a correlation coefficient (R) of 0.182 and weighted average of 96.6%. Similarly, the statistical analysis conducted on geographies consisting of 83,337,655 people shows no correlation between the proportion of Sierra Leoneans and percentage of population with at least nursery school education in the United States with a correlation coefficient (R) of -0.020 and weighted average of 97.7%, a difference of 1.2%.
Nursery School Correlation Summary
| Measurement | Guatemalan | Sierra Leonean |
| Minimum | 89.4% | 94.3% |
| Maximum | 100.0% | 100.0% |
| Range | 10.6% | 5.7% |
| Mean | 95.8% | 98.1% |
| Median | 96.1% | 98.1% |
| Interquartile 25% (IQ1) | 94.1% | 97.6% |
| Interquartile 75% (IQ3) | 97.3% | 98.9% |
| Interquartile Range (IQR) | 3.2% | 1.2% |
| Standard Deviation (Sample) | 2.5% | 1.2% |
| Standard Deviation (Population) | 2.5% | 1.2% |
Similar Demographics by Nursery School
Demographics Similar to Guatemalans by Nursery School
In terms of nursery school, the demographic groups most similar to Guatemalans are Bangladeshi (96.6%, a difference of 0.020%), Immigrants from Cambodia (96.5%, a difference of 0.040%), Immigrants from Fiji (96.5%, a difference of 0.040%), Immigrants from Dominican Republic (96.6%, a difference of 0.050%), and Central American (96.6%, a difference of 0.060%).
| Demographics | Rating | Rank | Nursery School |
| Immigrants | Vietnam | 0.0 /100 | #329 | Tragic 96.7% |
| Japanese | 0.0 /100 | #330 | Tragic 96.7% |
| Immigrants | Armenia | 0.0 /100 | #331 | Tragic 96.7% |
| Yakama | 0.0 /100 | #332 | Tragic 96.6% |
| Central Americans | 0.0 /100 | #333 | Tragic 96.6% |
| Immigrants | Dominican Republic | 0.0 /100 | #334 | Tragic 96.6% |
| Bangladeshis | 0.0 /100 | #335 | Tragic 96.6% |
| Guatemalans | 0.0 /100 | #336 | Tragic 96.6% |
| Immigrants | Cambodia | 0.0 /100 | #337 | Tragic 96.5% |
| Immigrants | Fiji | 0.0 /100 | #338 | Tragic 96.5% |
| Immigrants | Guatemala | 0.0 /100 | #339 | Tragic 96.4% |
| Immigrants | Central America | 0.0 /100 | #340 | Tragic 96.4% |
| Immigrants | Cabo Verde | 0.0 /100 | #341 | Tragic 96.4% |
| Immigrants | Mexico | 0.0 /100 | #342 | Tragic 96.4% |
| Salvadorans | 0.0 /100 | #343 | Tragic 96.4% |
Demographics Similar to Sierra Leoneans by Nursery School
In terms of nursery school, the demographic groups most similar to Sierra Leoneans are Immigrants from Costa Rica (97.7%, a difference of 0.010%), Iraqi (97.7%, a difference of 0.010%), Subsaharan African (97.7%, a difference of 0.010%), Sudanese (97.7%, a difference of 0.010%), and Senegalese (97.7%, a difference of 0.010%).
| Demographics | Rating | Rank | Nursery School |
| Immigrants | Sudan | 3.9 /100 | #223 | Tragic 97.7% |
| Immigrants | Nepal | 3.6 /100 | #224 | Tragic 97.7% |
| Immigrants | Costa Rica | 3.5 /100 | #225 | Tragic 97.7% |
| Iraqis | 3.5 /100 | #226 | Tragic 97.7% |
| Sub-Saharan Africans | 3.2 /100 | #227 | Tragic 97.7% |
| Sudanese | 3.2 /100 | #228 | Tragic 97.7% |
| Senegalese | 3.2 /100 | #229 | Tragic 97.7% |
| Sierra Leoneans | 2.9 /100 | #230 | Tragic 97.7% |
| Puerto Ricans | 2.6 /100 | #231 | Tragic 97.7% |
| Immigrants | Uruguay | 2.3 /100 | #232 | Tragic 97.7% |
| U.S. Virgin Islanders | 2.1 /100 | #233 | Tragic 97.7% |
| Colombians | 2.1 /100 | #234 | Tragic 97.7% |
| Immigrants | Pakistan | 2.1 /100 | #235 | Tragic 97.7% |
| Immigrants | Malaysia | 1.9 /100 | #236 | Tragic 97.7% |
| Immigrants | Western Asia | 1.9 /100 | #237 | Tragic 97.7% |