Guatemalan vs Immigrants from Indonesia Nursery School
COMPARE
Guatemalan
Immigrants from Indonesia
Nursery School
Nursery School Comparison
Guatemalans
Immigrants from Indonesia
96.6%
NURSERY SCHOOL
0.0/ 100
METRIC RATING
336th/ 347
METRIC RANK
97.7%
NURSERY SCHOOL
1.1/ 100
METRIC RATING
241st/ 347
METRIC RANK
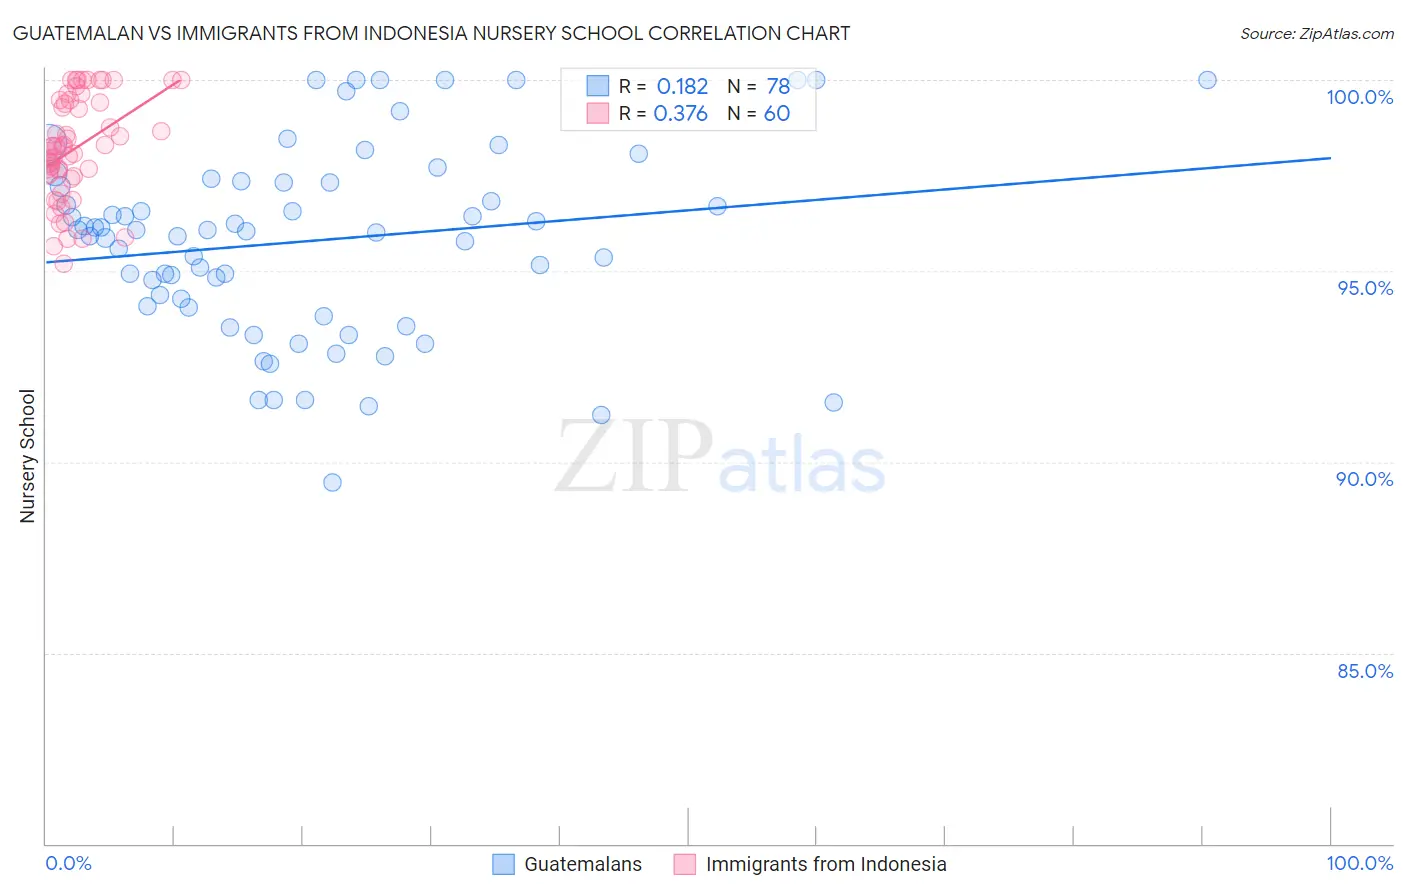
Guatemalan vs Immigrants from Indonesia Nursery School Correlation Chart
The statistical analysis conducted on geographies consisting of 409,566,469 people shows a poor positive correlation between the proportion of Guatemalans and percentage of population with at least nursery school education in the United States with a correlation coefficient (R) of 0.182 and weighted average of 96.6%. Similarly, the statistical analysis conducted on geographies consisting of 215,783,142 people shows a mild positive correlation between the proportion of Immigrants from Indonesia and percentage of population with at least nursery school education in the United States with a correlation coefficient (R) of 0.376 and weighted average of 97.7%, a difference of 1.1%.
Nursery School Correlation Summary
| Measurement | Guatemalan | Immigrants from Indonesia |
| Minimum | 89.4% | 95.2% |
| Maximum | 100.0% | 100.0% |
| Range | 10.6% | 4.8% |
| Mean | 95.8% | 98.2% |
| Median | 96.1% | 98.3% |
| Interquartile 25% (IQ1) | 94.1% | 97.5% |
| Interquartile 75% (IQ3) | 97.3% | 99.4% |
| Interquartile Range (IQR) | 3.2% | 1.9% |
| Standard Deviation (Sample) | 2.5% | 1.3% |
| Standard Deviation (Population) | 2.5% | 1.3% |
Similar Demographics by Nursery School
Demographics Similar to Guatemalans by Nursery School
In terms of nursery school, the demographic groups most similar to Guatemalans are Bangladeshi (96.6%, a difference of 0.020%), Immigrants from Cambodia (96.5%, a difference of 0.040%), Immigrants from Fiji (96.5%, a difference of 0.040%), Immigrants from Dominican Republic (96.6%, a difference of 0.050%), and Central American (96.6%, a difference of 0.060%).
| Demographics | Rating | Rank | Nursery School |
| Immigrants | Vietnam | 0.0 /100 | #329 | Tragic 96.7% |
| Japanese | 0.0 /100 | #330 | Tragic 96.7% |
| Immigrants | Armenia | 0.0 /100 | #331 | Tragic 96.7% |
| Yakama | 0.0 /100 | #332 | Tragic 96.6% |
| Central Americans | 0.0 /100 | #333 | Tragic 96.6% |
| Immigrants | Dominican Republic | 0.0 /100 | #334 | Tragic 96.6% |
| Bangladeshis | 0.0 /100 | #335 | Tragic 96.6% |
| Guatemalans | 0.0 /100 | #336 | Tragic 96.6% |
| Immigrants | Cambodia | 0.0 /100 | #337 | Tragic 96.5% |
| Immigrants | Fiji | 0.0 /100 | #338 | Tragic 96.5% |
| Immigrants | Guatemala | 0.0 /100 | #339 | Tragic 96.4% |
| Immigrants | Central America | 0.0 /100 | #340 | Tragic 96.4% |
| Immigrants | Cabo Verde | 0.0 /100 | #341 | Tragic 96.4% |
| Immigrants | Mexico | 0.0 /100 | #342 | Tragic 96.4% |
| Salvadorans | 0.0 /100 | #343 | Tragic 96.4% |
Demographics Similar to Immigrants from Indonesia by Nursery School
In terms of nursery school, the demographic groups most similar to Immigrants from Indonesia are Liberian (97.7%, a difference of 0.0%), Asian (97.6%, a difference of 0.010%), South American (97.6%, a difference of 0.010%), Bolivian (97.6%, a difference of 0.010%), and Peruvian (97.6%, a difference of 0.010%).
| Demographics | Rating | Rank | Nursery School |
| Colombians | 2.1 /100 | #234 | Tragic 97.7% |
| Immigrants | Pakistan | 2.1 /100 | #235 | Tragic 97.7% |
| Immigrants | Malaysia | 1.9 /100 | #236 | Tragic 97.7% |
| Immigrants | Western Asia | 1.9 /100 | #237 | Tragic 97.7% |
| Nigerians | 1.7 /100 | #238 | Tragic 97.7% |
| Immigrants | Eastern Asia | 1.6 /100 | #239 | Tragic 97.7% |
| Koreans | 1.4 /100 | #240 | Tragic 97.7% |
| Immigrants | Indonesia | 1.1 /100 | #241 | Tragic 97.7% |
| Liberians | 1.1 /100 | #242 | Tragic 97.7% |
| Asians | 1.1 /100 | #243 | Tragic 97.6% |
| South Americans | 1.0 /100 | #244 | Tragic 97.6% |
| Bolivians | 1.0 /100 | #245 | Tragic 97.6% |
| Peruvians | 1.0 /100 | #246 | Tragic 97.6% |
| Immigrants | Middle Africa | 0.9 /100 | #247 | Tragic 97.6% |
| Indians (Asian) | 0.9 /100 | #248 | Tragic 97.6% |