Guatemalan vs Immigrants from Korea 9th Grade
COMPARE
Guatemalan
Immigrants from Korea
9th Grade
9th Grade Comparison
Guatemalans
Immigrants from Korea
89.9%
9TH GRADE
0.0/ 100
METRIC RATING
341st/ 347
METRIC RANK
95.1%
9TH GRADE
79.6/ 100
METRIC RATING
149th/ 347
METRIC RANK
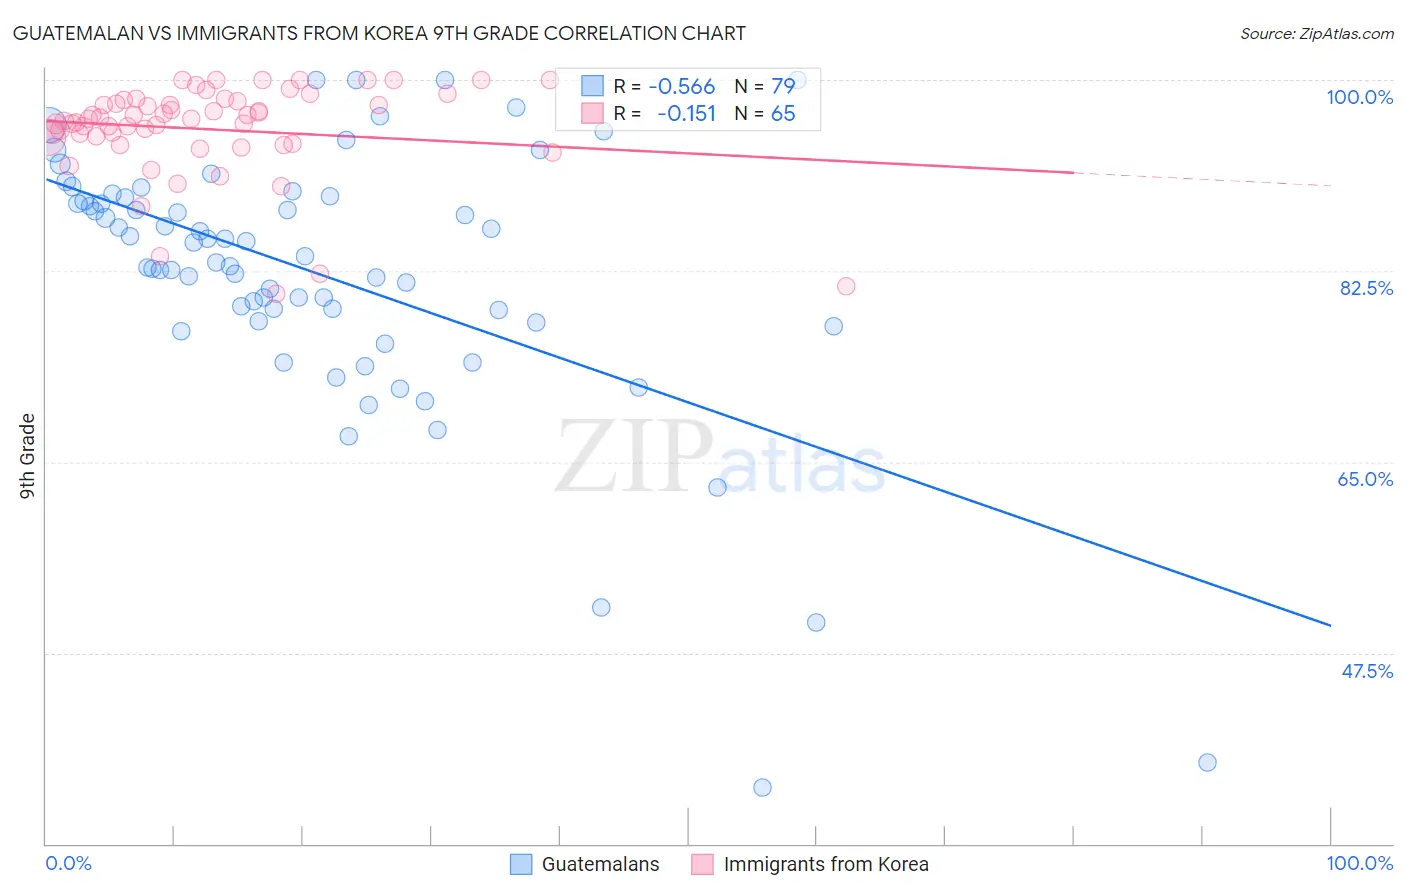
Guatemalan vs Immigrants from Korea 9th Grade Correlation Chart
The statistical analysis conducted on geographies consisting of 409,566,618 people shows a substantial negative correlation between the proportion of Guatemalans and percentage of population with at least 9th grade education in the United States with a correlation coefficient (R) of -0.566 and weighted average of 89.9%. Similarly, the statistical analysis conducted on geographies consisting of 416,280,217 people shows a poor negative correlation between the proportion of Immigrants from Korea and percentage of population with at least 9th grade education in the United States with a correlation coefficient (R) of -0.151 and weighted average of 95.1%, a difference of 5.8%.
9th Grade Correlation Summary
| Measurement | Guatemalan | Immigrants from Korea |
| Minimum | 35.2% | 80.4% |
| Maximum | 100.0% | 100.0% |
| Range | 64.8% | 19.6% |
| Mean | 82.2% | 95.5% |
| Median | 83.9% | 96.4% |
| Interquartile 25% (IQ1) | 77.9% | 94.5% |
| Interquartile 75% (IQ3) | 89.2% | 98.1% |
| Interquartile Range (IQR) | 11.3% | 3.6% |
| Standard Deviation (Sample) | 12.1% | 4.4% |
| Standard Deviation (Population) | 12.1% | 4.3% |
Similar Demographics by 9th Grade
Demographics Similar to Guatemalans by 9th Grade
In terms of 9th grade, the demographic groups most similar to Guatemalans are Mexican (90.0%, a difference of 0.13%), Yakama (90.1%, a difference of 0.19%), Salvadoran (89.6%, a difference of 0.31%), Immigrants from Guatemala (89.4%, a difference of 0.51%), and Central American (90.4%, a difference of 0.52%).
| Demographics | Rating | Rank | 9th Grade |
| Immigrants | Yemen | 0.0 /100 | #333 | Tragic 90.8% |
| Immigrants | Azores | 0.0 /100 | #334 | Tragic 90.8% |
| Immigrants | Honduras | 0.0 /100 | #335 | Tragic 90.6% |
| Immigrants | Dominican Republic | 0.0 /100 | #336 | Tragic 90.5% |
| Immigrants | Latin America | 0.0 /100 | #337 | Tragic 90.4% |
| Central Americans | 0.0 /100 | #338 | Tragic 90.4% |
| Yakama | 0.0 /100 | #339 | Tragic 90.1% |
| Mexicans | 0.0 /100 | #340 | Tragic 90.0% |
| Guatemalans | 0.0 /100 | #341 | Tragic 89.9% |
| Salvadorans | 0.0 /100 | #342 | Tragic 89.6% |
| Immigrants | Guatemala | 0.0 /100 | #343 | Tragic 89.4% |
| Immigrants | El Salvador | 0.0 /100 | #344 | Tragic 89.0% |
| Immigrants | Central America | 0.0 /100 | #345 | Tragic 89.0% |
| Immigrants | Mexico | 0.0 /100 | #346 | Tragic 88.7% |
| Spanish American Indians | 0.0 /100 | #347 | Tragic 88.3% |
Demographics Similar to Immigrants from Korea by 9th Grade
In terms of 9th grade, the demographic groups most similar to Immigrants from Korea are Kenyan (95.1%, a difference of 0.010%), Immigrants from Jordan (95.1%, a difference of 0.020%), Cajun (95.1%, a difference of 0.020%), Pueblo (95.1%, a difference of 0.030%), and Immigrants from Sri Lanka (95.1%, a difference of 0.030%).
| Demographics | Rating | Rank | 9th Grade |
| Immigrants | Greece | 84.6 /100 | #142 | Excellent 95.2% |
| Spanish | 84.4 /100 | #143 | Excellent 95.2% |
| Yup'ik | 83.3 /100 | #144 | Excellent 95.2% |
| Pueblo | 82.2 /100 | #145 | Excellent 95.1% |
| Immigrants | Sri Lanka | 82.1 /100 | #146 | Excellent 95.1% |
| Choctaw | 81.9 /100 | #147 | Excellent 95.1% |
| Immigrants | Jordan | 81.2 /100 | #148 | Excellent 95.1% |
| Immigrants | Korea | 79.6 /100 | #149 | Good 95.1% |
| Kenyans | 79.1 /100 | #150 | Good 95.1% |
| Cajuns | 77.3 /100 | #151 | Good 95.1% |
| Ugandans | 77.0 /100 | #152 | Good 95.1% |
| Albanians | 76.1 /100 | #153 | Good 95.1% |
| Arabs | 74.9 /100 | #154 | Good 95.1% |
| Immigrants | Kazakhstan | 74.7 /100 | #155 | Good 95.1% |
| Immigrants | Kenya | 73.1 /100 | #156 | Good 95.0% |