Guatemalan vs Immigrants from Bolivia 9th Grade
COMPARE
Guatemalan
Immigrants from Bolivia
9th Grade
9th Grade Comparison
Guatemalans
Immigrants from Bolivia
89.9%
9TH GRADE
0.0/ 100
METRIC RATING
341st/ 347
METRIC RANK
93.9%
9TH GRADE
0.3/ 100
METRIC RATING
268th/ 347
METRIC RANK
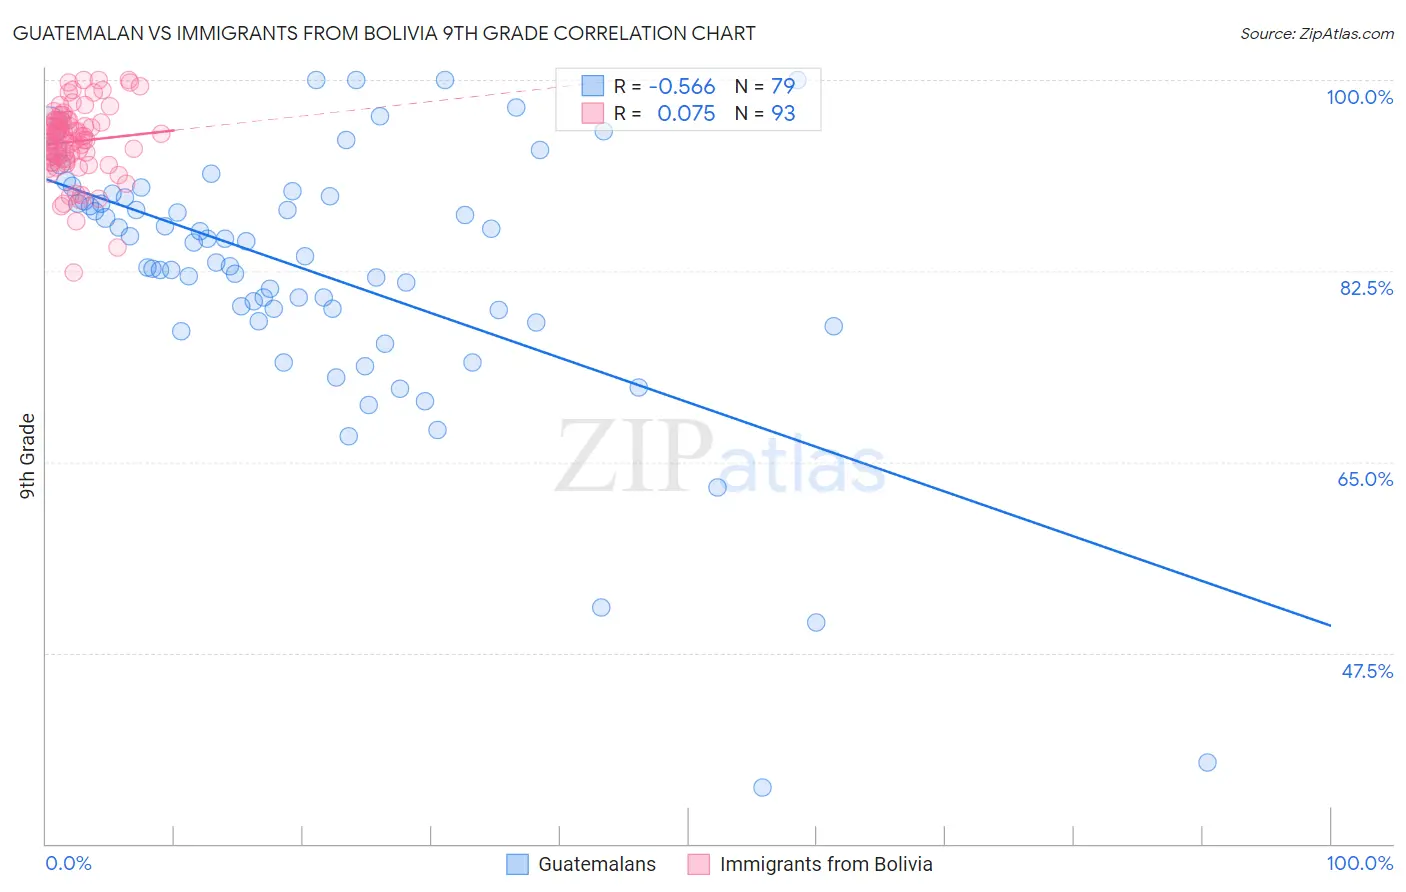
Guatemalan vs Immigrants from Bolivia 9th Grade Correlation Chart
The statistical analysis conducted on geographies consisting of 409,566,618 people shows a substantial negative correlation between the proportion of Guatemalans and percentage of population with at least 9th grade education in the United States with a correlation coefficient (R) of -0.566 and weighted average of 89.9%. Similarly, the statistical analysis conducted on geographies consisting of 158,727,043 people shows a slight positive correlation between the proportion of Immigrants from Bolivia and percentage of population with at least 9th grade education in the United States with a correlation coefficient (R) of 0.075 and weighted average of 93.9%, a difference of 4.4%.
9th Grade Correlation Summary
| Measurement | Guatemalan | Immigrants from Bolivia |
| Minimum | 35.2% | 82.4% |
| Maximum | 100.0% | 100.0% |
| Range | 64.8% | 17.6% |
| Mean | 82.2% | 94.3% |
| Median | 83.9% | 94.7% |
| Interquartile 25% (IQ1) | 77.9% | 92.8% |
| Interquartile 75% (IQ3) | 89.2% | 96.2% |
| Interquartile Range (IQR) | 11.3% | 3.4% |
| Standard Deviation (Sample) | 12.1% | 3.2% |
| Standard Deviation (Population) | 12.1% | 3.2% |
Similar Demographics by 9th Grade
Demographics Similar to Guatemalans by 9th Grade
In terms of 9th grade, the demographic groups most similar to Guatemalans are Mexican (90.0%, a difference of 0.13%), Yakama (90.1%, a difference of 0.19%), Salvadoran (89.6%, a difference of 0.31%), Immigrants from Guatemala (89.4%, a difference of 0.51%), and Central American (90.4%, a difference of 0.52%).
| Demographics | Rating | Rank | 9th Grade |
| Immigrants | Yemen | 0.0 /100 | #333 | Tragic 90.8% |
| Immigrants | Azores | 0.0 /100 | #334 | Tragic 90.8% |
| Immigrants | Honduras | 0.0 /100 | #335 | Tragic 90.6% |
| Immigrants | Dominican Republic | 0.0 /100 | #336 | Tragic 90.5% |
| Immigrants | Latin America | 0.0 /100 | #337 | Tragic 90.4% |
| Central Americans | 0.0 /100 | #338 | Tragic 90.4% |
| Yakama | 0.0 /100 | #339 | Tragic 90.1% |
| Mexicans | 0.0 /100 | #340 | Tragic 90.0% |
| Guatemalans | 0.0 /100 | #341 | Tragic 89.9% |
| Salvadorans | 0.0 /100 | #342 | Tragic 89.6% |
| Immigrants | Guatemala | 0.0 /100 | #343 | Tragic 89.4% |
| Immigrants | El Salvador | 0.0 /100 | #344 | Tragic 89.0% |
| Immigrants | Central America | 0.0 /100 | #345 | Tragic 89.0% |
| Immigrants | Mexico | 0.0 /100 | #346 | Tragic 88.7% |
| Spanish American Indians | 0.0 /100 | #347 | Tragic 88.3% |
Demographics Similar to Immigrants from Bolivia by 9th Grade
In terms of 9th grade, the demographic groups most similar to Immigrants from Bolivia are Armenian (93.9%, a difference of 0.020%), Navajo (93.9%, a difference of 0.030%), Immigrants from Congo (93.9%, a difference of 0.040%), Native/Alaskan (93.9%, a difference of 0.040%), and Immigrants from Uruguay (93.8%, a difference of 0.040%).
| Demographics | Rating | Rank | 9th Grade |
| South Americans | 0.4 /100 | #261 | Tragic 93.9% |
| Immigrants | Jamaica | 0.4 /100 | #262 | Tragic 93.9% |
| Immigrants | Uzbekistan | 0.4 /100 | #263 | Tragic 93.9% |
| Immigrants | Congo | 0.4 /100 | #264 | Tragic 93.9% |
| Natives/Alaskans | 0.4 /100 | #265 | Tragic 93.9% |
| Navajo | 0.3 /100 | #266 | Tragic 93.9% |
| Armenians | 0.3 /100 | #267 | Tragic 93.9% |
| Immigrants | Bolivia | 0.3 /100 | #268 | Tragic 93.9% |
| Immigrants | Uruguay | 0.2 /100 | #269 | Tragic 93.8% |
| Yuman | 0.2 /100 | #270 | Tragic 93.8% |
| Immigrants | Ghana | 0.2 /100 | #271 | Tragic 93.8% |
| Immigrants | Western Africa | 0.2 /100 | #272 | Tragic 93.8% |
| Immigrants | South America | 0.2 /100 | #273 | Tragic 93.8% |
| Peruvians | 0.2 /100 | #274 | Tragic 93.8% |
| Immigrants | Colombia | 0.2 /100 | #275 | Tragic 93.8% |