Cape Verdean vs Immigrants from Ghana Doctorate Degree
COMPARE
Cape Verdean
Immigrants from Ghana
Doctorate Degree
Doctorate Degree Comparison
Cape Verdeans
Immigrants from Ghana
1.4%
DOCTORATE DEGREE
0.3/ 100
METRIC RATING
289th/ 347
METRIC RANK
1.8%
DOCTORATE DEGREE
24.6/ 100
METRIC RATING
198th/ 347
METRIC RANK
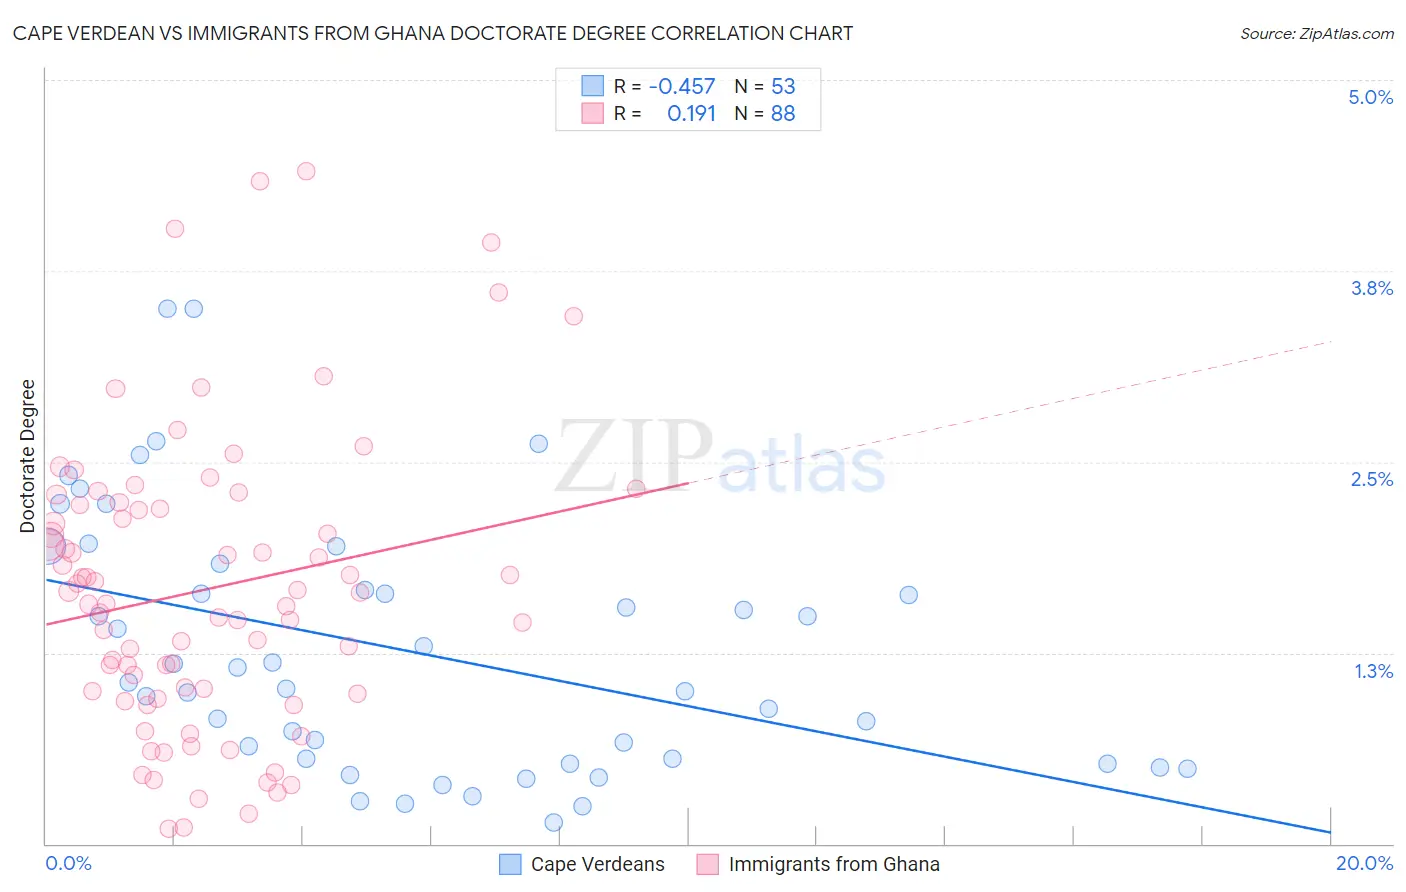
Cape Verdean vs Immigrants from Ghana Doctorate Degree Correlation Chart
The statistical analysis conducted on geographies consisting of 107,405,258 people shows a moderate negative correlation between the proportion of Cape Verdeans and percentage of population with at least doctorate degree education in the United States with a correlation coefficient (R) of -0.457 and weighted average of 1.4%. Similarly, the statistical analysis conducted on geographies consisting of 199,222,396 people shows a poor positive correlation between the proportion of Immigrants from Ghana and percentage of population with at least doctorate degree education in the United States with a correlation coefficient (R) of 0.191 and weighted average of 1.8%, a difference of 22.0%.
Doctorate Degree Correlation Summary
| Measurement | Cape Verdean | Immigrants from Ghana |
| Minimum | 0.14% | 0.098% |
| Maximum | 3.5% | 4.4% |
| Range | 3.4% | 4.3% |
| Mean | 1.3% | 1.7% |
| Median | 1.1% | 1.6% |
| Interquartile 25% (IQ1) | 0.54% | 0.99% |
| Interquartile 75% (IQ3) | 1.7% | 2.2% |
| Interquartile Range (IQR) | 1.2% | 1.2% |
| Standard Deviation (Sample) | 0.83% | 0.95% |
| Standard Deviation (Population) | 0.82% | 0.94% |
Similar Demographics by Doctorate Degree
Demographics Similar to Cape Verdeans by Doctorate Degree
In terms of doctorate degree, the demographic groups most similar to Cape Verdeans are Choctaw (1.4%, a difference of 0.020%), Immigrants from El Salvador (1.4%, a difference of 0.14%), Black/African American (1.4%, a difference of 0.24%), Cajun (1.5%, a difference of 0.31%), and Alaska Native (1.4%, a difference of 0.42%).
| Demographics | Rating | Rank | Doctorate Degree |
| British West Indians | 0.3 /100 | #282 | Tragic 1.5% |
| Central Americans | 0.3 /100 | #283 | Tragic 1.5% |
| Jamaicans | 0.3 /100 | #284 | Tragic 1.5% |
| Malaysians | 0.3 /100 | #285 | Tragic 1.5% |
| Cherokee | 0.3 /100 | #286 | Tragic 1.5% |
| Cajuns | 0.3 /100 | #287 | Tragic 1.5% |
| Immigrants | El Salvador | 0.3 /100 | #288 | Tragic 1.4% |
| Cape Verdeans | 0.3 /100 | #289 | Tragic 1.4% |
| Choctaw | 0.3 /100 | #290 | Tragic 1.4% |
| Blacks/African Americans | 0.3 /100 | #291 | Tragic 1.4% |
| Alaska Natives | 0.3 /100 | #292 | Tragic 1.4% |
| Immigrants | Yemen | 0.2 /100 | #293 | Tragic 1.4% |
| Samoans | 0.2 /100 | #294 | Tragic 1.4% |
| Guatemalans | 0.2 /100 | #295 | Tragic 1.4% |
| Immigrants | Ecuador | 0.2 /100 | #296 | Tragic 1.4% |
Demographics Similar to Immigrants from Ghana by Doctorate Degree
In terms of doctorate degree, the demographic groups most similar to Immigrants from Ghana are Chinese (1.8%, a difference of 0.080%), Subsaharan African (1.8%, a difference of 0.090%), Immigrants from Somalia (1.8%, a difference of 0.16%), Immigrants from South America (1.8%, a difference of 0.29%), and Uruguayan (1.8%, a difference of 0.31%).
| Demographics | Rating | Rank | Doctorate Degree |
| South Americans | 29.5 /100 | #191 | Fair 1.8% |
| Dutch | 27.4 /100 | #192 | Fair 1.8% |
| German Russians | 27.1 /100 | #193 | Fair 1.8% |
| Uruguayans | 26.2 /100 | #194 | Fair 1.8% |
| Immigrants | Somalia | 25.4 /100 | #195 | Fair 1.8% |
| Sub-Saharan Africans | 25.1 /100 | #196 | Fair 1.8% |
| Chinese | 25.1 /100 | #197 | Fair 1.8% |
| Immigrants | Ghana | 24.6 /100 | #198 | Fair 1.8% |
| Immigrants | South America | 23.3 /100 | #199 | Fair 1.8% |
| Whites/Caucasians | 22.8 /100 | #200 | Fair 1.8% |
| Immigrants | Nigeria | 22.4 /100 | #201 | Fair 1.8% |
| Portuguese | 21.4 /100 | #202 | Fair 1.8% |
| Immigrants | Vietnam | 21.4 /100 | #203 | Fair 1.8% |
| Somalis | 21.2 /100 | #204 | Fair 1.7% |
| Venezuelans | 19.5 /100 | #205 | Poor 1.7% |