Menominee vs Immigrants from Ghana Doctorate Degree
COMPARE
Menominee
Immigrants from Ghana
Doctorate Degree
Doctorate Degree Comparison
Menominee
Immigrants from Ghana
1.4%
DOCTORATE DEGREE
0.1/ 100
METRIC RATING
313th/ 347
METRIC RANK
1.8%
DOCTORATE DEGREE
24.6/ 100
METRIC RATING
198th/ 347
METRIC RANK
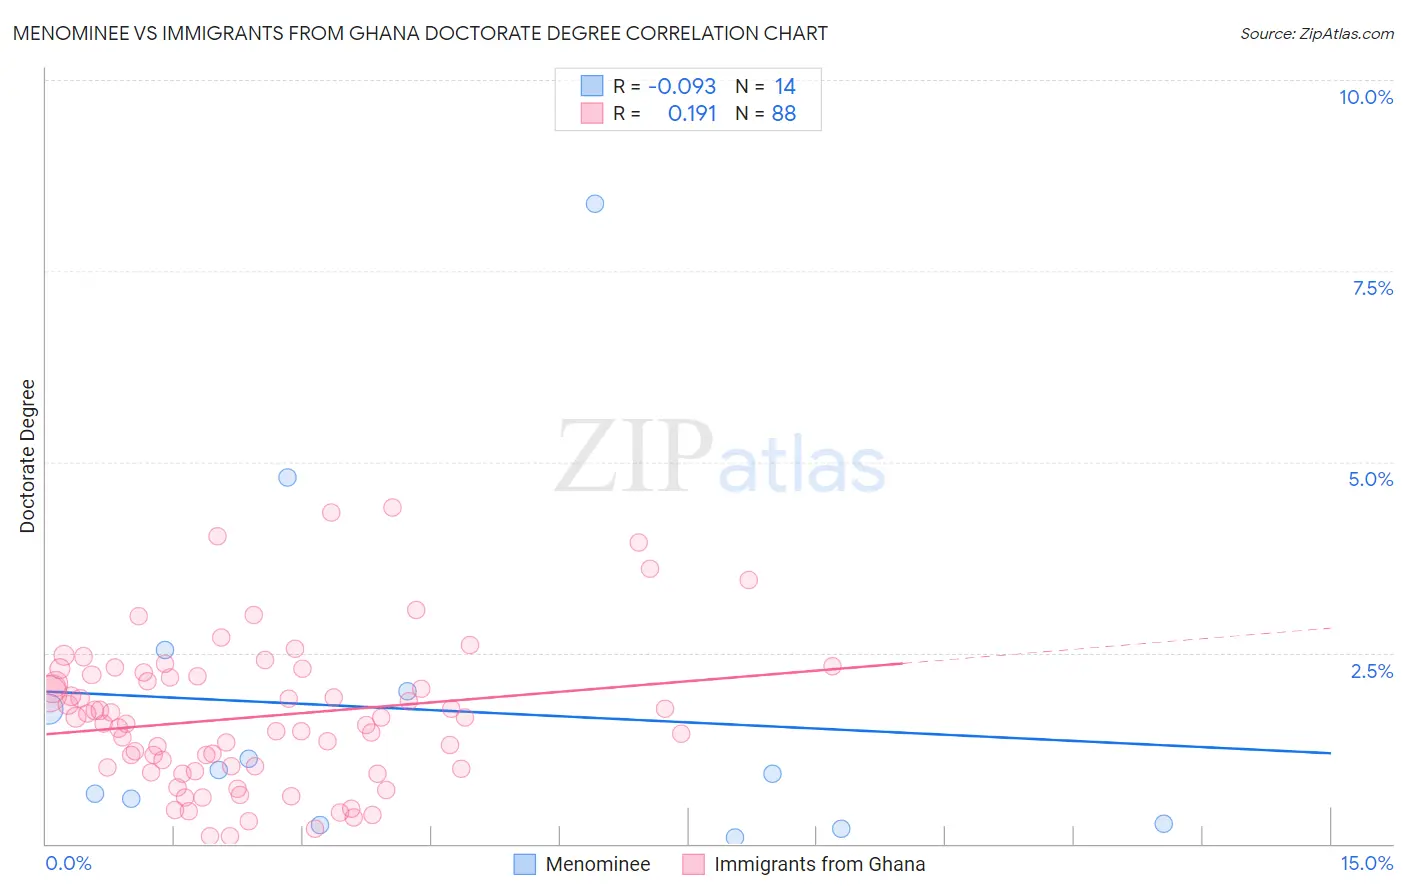
Menominee vs Immigrants from Ghana Doctorate Degree Correlation Chart
The statistical analysis conducted on geographies consisting of 45,550,616 people shows a slight negative correlation between the proportion of Menominee and percentage of population with at least doctorate degree education in the United States with a correlation coefficient (R) of -0.093 and weighted average of 1.4%. Similarly, the statistical analysis conducted on geographies consisting of 199,222,396 people shows a poor positive correlation between the proportion of Immigrants from Ghana and percentage of population with at least doctorate degree education in the United States with a correlation coefficient (R) of 0.191 and weighted average of 1.8%, a difference of 30.2%.
Doctorate Degree Correlation Summary
| Measurement | Menominee | Immigrants from Ghana |
| Minimum | 0.087% | 0.098% |
| Maximum | 8.4% | 4.4% |
| Range | 8.3% | 4.3% |
| Mean | 1.8% | 1.7% |
| Median | 0.94% | 1.6% |
| Interquartile 25% (IQ1) | 0.26% | 0.99% |
| Interquartile 75% (IQ3) | 2.0% | 2.2% |
| Interquartile Range (IQR) | 1.7% | 1.2% |
| Standard Deviation (Sample) | 2.3% | 0.95% |
| Standard Deviation (Population) | 2.2% | 0.94% |
Similar Demographics by Doctorate Degree
Demographics Similar to Menominee by Doctorate Degree
In terms of doctorate degree, the demographic groups most similar to Menominee are Dominican (1.4%, a difference of 0.080%), Immigrants from the Azores (1.4%, a difference of 0.10%), Navajo (1.4%, a difference of 0.31%), Immigrants from Nicaragua (1.4%, a difference of 0.32%), and Immigrants from Micronesia (1.3%, a difference of 0.55%).
| Demographics | Rating | Rank | Doctorate Degree |
| Guyanese | 0.1 /100 | #306 | Tragic 1.4% |
| Cubans | 0.1 /100 | #307 | Tragic 1.4% |
| Immigrants | Laos | 0.1 /100 | #308 | Tragic 1.4% |
| Immigrants | Grenada | 0.1 /100 | #309 | Tragic 1.4% |
| Immigrants | Jamaica | 0.1 /100 | #310 | Tragic 1.4% |
| Immigrants | Honduras | 0.1 /100 | #311 | Tragic 1.4% |
| Immigrants | Nicaragua | 0.1 /100 | #312 | Tragic 1.4% |
| Menominee | 0.1 /100 | #313 | Tragic 1.4% |
| Dominicans | 0.1 /100 | #314 | Tragic 1.4% |
| Immigrants | Azores | 0.1 /100 | #315 | Tragic 1.4% |
| Navajo | 0.1 /100 | #316 | Tragic 1.4% |
| Immigrants | Micronesia | 0.1 /100 | #317 | Tragic 1.3% |
| Creek | 0.1 /100 | #318 | Tragic 1.3% |
| Immigrants | Guyana | 0.1 /100 | #319 | Tragic 1.3% |
| Immigrants | St. Vincent and the Grenadines | 0.1 /100 | #320 | Tragic 1.3% |
Demographics Similar to Immigrants from Ghana by Doctorate Degree
In terms of doctorate degree, the demographic groups most similar to Immigrants from Ghana are Chinese (1.8%, a difference of 0.080%), Subsaharan African (1.8%, a difference of 0.090%), Immigrants from Somalia (1.8%, a difference of 0.16%), Immigrants from South America (1.8%, a difference of 0.29%), and Uruguayan (1.8%, a difference of 0.31%).
| Demographics | Rating | Rank | Doctorate Degree |
| South Americans | 29.5 /100 | #191 | Fair 1.8% |
| Dutch | 27.4 /100 | #192 | Fair 1.8% |
| German Russians | 27.1 /100 | #193 | Fair 1.8% |
| Uruguayans | 26.2 /100 | #194 | Fair 1.8% |
| Immigrants | Somalia | 25.4 /100 | #195 | Fair 1.8% |
| Sub-Saharan Africans | 25.1 /100 | #196 | Fair 1.8% |
| Chinese | 25.1 /100 | #197 | Fair 1.8% |
| Immigrants | Ghana | 24.6 /100 | #198 | Fair 1.8% |
| Immigrants | South America | 23.3 /100 | #199 | Fair 1.8% |
| Whites/Caucasians | 22.8 /100 | #200 | Fair 1.8% |
| Immigrants | Nigeria | 22.4 /100 | #201 | Fair 1.8% |
| Portuguese | 21.4 /100 | #202 | Fair 1.8% |
| Immigrants | Vietnam | 21.4 /100 | #203 | Fair 1.8% |
| Somalis | 21.2 /100 | #204 | Fair 1.7% |
| Venezuelans | 19.5 /100 | #205 | Poor 1.7% |