Carpatho Rusyn vs Subsaharan African Bachelor's Degree
COMPARE
Carpatho Rusyn
Subsaharan African
Bachelor's Degree
Bachelor's Degree Comparison
Carpatho Rusyns
Sub-Saharan Africans
42.1%
BACHELOR'S DEGREE
99.0/ 100
METRIC RATING
87th/ 347
METRIC RANK
35.8%
BACHELOR'S DEGREE
9.8/ 100
METRIC RATING
218th/ 347
METRIC RANK
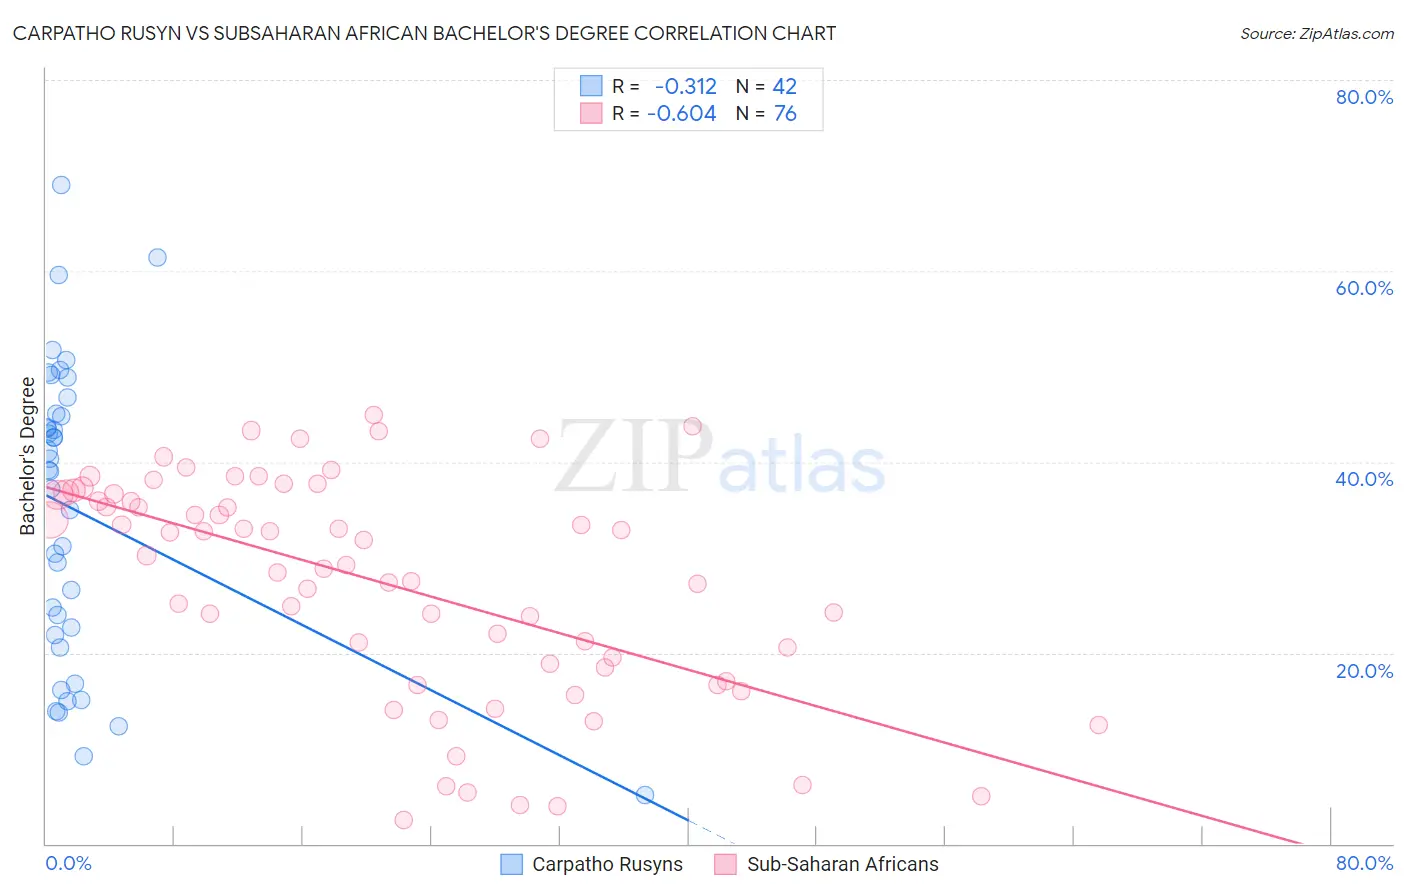
Carpatho Rusyn vs Subsaharan African Bachelor's Degree Correlation Chart
The statistical analysis conducted on geographies consisting of 58,871,690 people shows a mild negative correlation between the proportion of Carpatho Rusyns and percentage of population with at least bachelor's degree education in the United States with a correlation coefficient (R) of -0.312 and weighted average of 42.1%. Similarly, the statistical analysis conducted on geographies consisting of 508,116,051 people shows a significant negative correlation between the proportion of Sub-Saharan Africans and percentage of population with at least bachelor's degree education in the United States with a correlation coefficient (R) of -0.604 and weighted average of 35.8%, a difference of 17.6%.
Bachelor's Degree Correlation Summary
| Measurement | Carpatho Rusyn | Subsaharan African |
| Minimum | 5.1% | 2.6% |
| Maximum | 69.0% | 44.9% |
| Range | 63.9% | 42.3% |
| Mean | 34.9% | 27.3% |
| Median | 39.1% | 29.7% |
| Interquartile 25% (IQ1) | 21.8% | 18.7% |
| Interquartile 75% (IQ3) | 45.0% | 36.6% |
| Interquartile Range (IQR) | 23.2% | 17.9% |
| Standard Deviation (Sample) | 15.6% | 11.5% |
| Standard Deviation (Population) | 15.4% | 11.4% |
Similar Demographics by Bachelor's Degree
Demographics Similar to Carpatho Rusyns by Bachelor's Degree
In terms of bachelor's degree, the demographic groups most similar to Carpatho Rusyns are Immigrants from Western Europe (42.0%, a difference of 0.12%), Greek (42.0%, a difference of 0.12%), Laotian (42.0%, a difference of 0.25%), Immigrants from Brazil (42.2%, a difference of 0.30%), and Immigrants from Northern Africa (41.9%, a difference of 0.35%).
| Demographics | Rating | Rank | Bachelor's Degree |
| Immigrants | Croatia | 99.2 /100 | #80 | Exceptional 42.3% |
| Immigrants | Hungary | 99.2 /100 | #81 | Exceptional 42.3% |
| Immigrants | Scotland | 99.2 /100 | #82 | Exceptional 42.3% |
| Armenians | 99.2 /100 | #83 | Exceptional 42.3% |
| Immigrants | Western Asia | 99.2 /100 | #84 | Exceptional 42.3% |
| Lithuanians | 99.2 /100 | #85 | Exceptional 42.2% |
| Immigrants | Brazil | 99.2 /100 | #86 | Exceptional 42.2% |
| Carpatho Rusyns | 99.0 /100 | #87 | Exceptional 42.1% |
| Immigrants | Western Europe | 99.0 /100 | #88 | Exceptional 42.0% |
| Greeks | 99.0 /100 | #89 | Exceptional 42.0% |
| Laotians | 98.9 /100 | #90 | Exceptional 42.0% |
| Immigrants | Northern Africa | 98.9 /100 | #91 | Exceptional 41.9% |
| Maltese | 98.8 /100 | #92 | Exceptional 41.9% |
| Immigrants | Canada | 98.6 /100 | #93 | Exceptional 41.7% |
| Immigrants | Nepal | 98.6 /100 | #94 | Exceptional 41.7% |
Demographics Similar to Sub-Saharan Africans by Bachelor's Degree
In terms of bachelor's degree, the demographic groups most similar to Sub-Saharan Africans are West Indian (35.8%, a difference of 0.030%), Spanish (35.8%, a difference of 0.070%), German Russian (35.8%, a difference of 0.10%), Dutch (35.7%, a difference of 0.18%), and Trinidadian and Tobagonian (35.7%, a difference of 0.32%).
| Demographics | Rating | Rank | Bachelor's Degree |
| Scotch-Irish | 18.3 /100 | #211 | Poor 36.4% |
| Immigrants | Philippines | 17.8 /100 | #212 | Poor 36.4% |
| Immigrants | Panama | 14.2 /100 | #213 | Poor 36.2% |
| Germans | 13.9 /100 | #214 | Poor 36.1% |
| Immigrants | Western Africa | 13.8 /100 | #215 | Poor 36.1% |
| Barbadians | 13.5 /100 | #216 | Poor 36.1% |
| German Russians | 10.2 /100 | #217 | Poor 35.8% |
| Sub-Saharan Africans | 9.8 /100 | #218 | Tragic 35.8% |
| West Indians | 9.7 /100 | #219 | Tragic 35.8% |
| Spanish | 9.6 /100 | #220 | Tragic 35.8% |
| Dutch | 9.2 /100 | #221 | Tragic 35.7% |
| Trinidadians and Tobagonians | 8.8 /100 | #222 | Tragic 35.7% |
| French Canadians | 8.3 /100 | #223 | Tragic 35.6% |
| Immigrants | Barbados | 7.5 /100 | #224 | Tragic 35.5% |
| Immigrants | Burma/Myanmar | 7.3 /100 | #225 | Tragic 35.5% |