Greek vs U.S. Virgin Islander Bachelor's Degree
COMPARE
Greek
U.S. Virgin Islander
Bachelor's Degree
Bachelor's Degree Comparison
Greeks
U.S. Virgin Islanders
42.0%
BACHELOR'S DEGREE
99.0/ 100
METRIC RATING
89th/ 347
METRIC RANK
33.2%
BACHELOR'S DEGREE
0.7/ 100
METRIC RATING
253rd/ 347
METRIC RANK
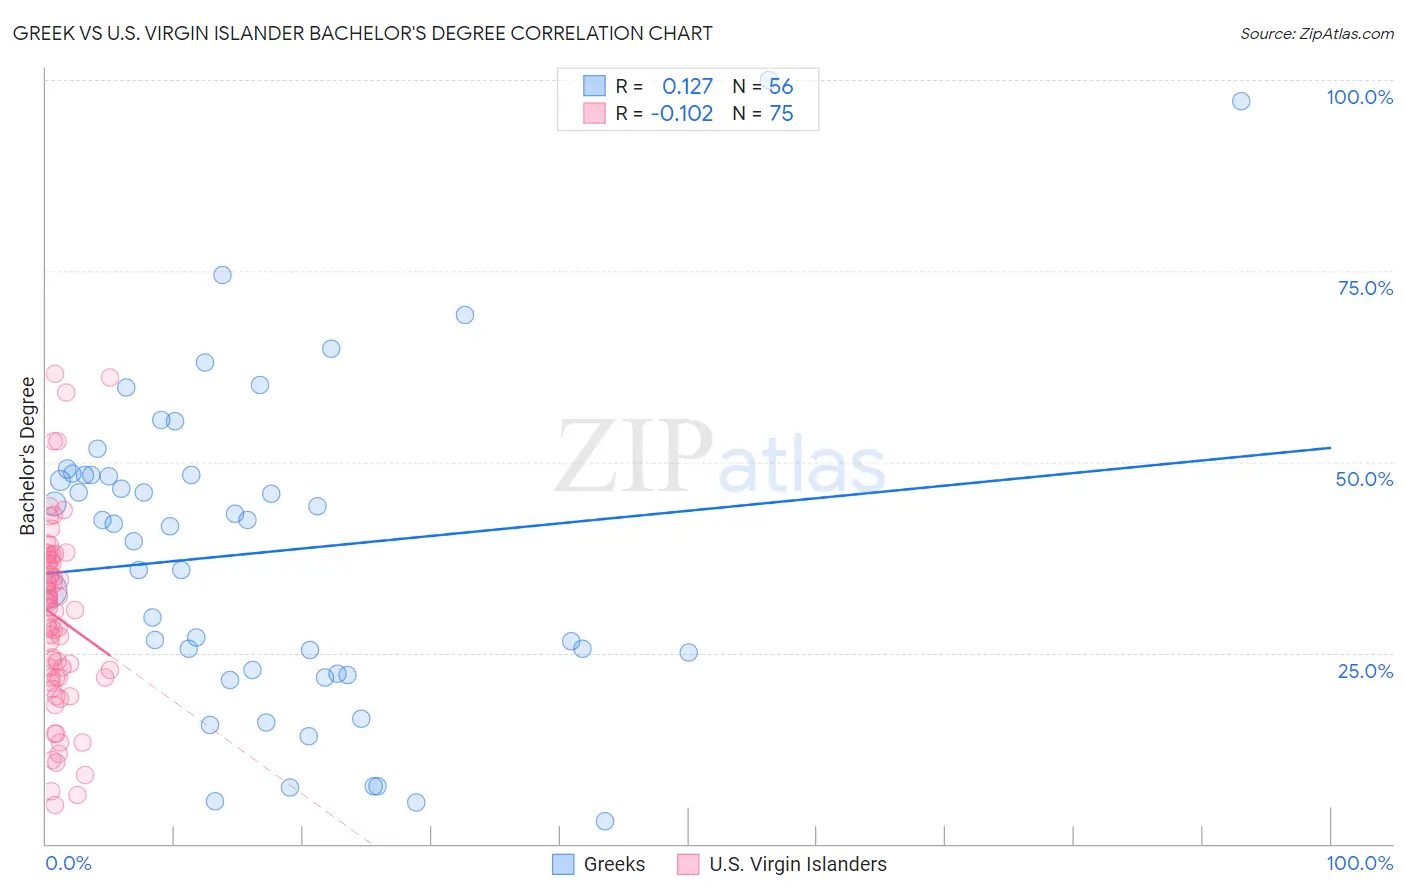
Greek vs U.S. Virgin Islander Bachelor's Degree Correlation Chart
The statistical analysis conducted on geographies consisting of 482,704,641 people shows a poor positive correlation between the proportion of Greeks and percentage of population with at least bachelor's degree education in the United States with a correlation coefficient (R) of 0.127 and weighted average of 42.0%. Similarly, the statistical analysis conducted on geographies consisting of 87,527,119 people shows a poor negative correlation between the proportion of U.S. Virgin Islanders and percentage of population with at least bachelor's degree education in the United States with a correlation coefficient (R) of -0.102 and weighted average of 33.2%, a difference of 26.5%.
Bachelor's Degree Correlation Summary
| Measurement | Greek | U.S. Virgin Islander |
| Minimum | 2.9% | 5.1% |
| Maximum | 100.0% | 61.5% |
| Range | 97.1% | 56.4% |
| Mean | 38.2% | 29.6% |
| Median | 41.8% | 30.7% |
| Interquartile 25% (IQ1) | 22.6% | 21.7% |
| Interquartile 75% (IQ3) | 48.3% | 37.1% |
| Interquartile Range (IQR) | 25.8% | 15.4% |
| Standard Deviation (Sample) | 21.1% | 12.3% |
| Standard Deviation (Population) | 20.9% | 12.2% |
Similar Demographics by Bachelor's Degree
Demographics Similar to Greeks by Bachelor's Degree
In terms of bachelor's degree, the demographic groups most similar to Greeks are Immigrants from Western Europe (42.0%, a difference of 0.0%), Carpatho Rusyn (42.1%, a difference of 0.12%), Laotian (42.0%, a difference of 0.12%), Immigrants from Northern Africa (41.9%, a difference of 0.22%), and Maltese (41.9%, a difference of 0.30%).
| Demographics | Rating | Rank | Bachelor's Degree |
| Immigrants | Scotland | 99.2 /100 | #82 | Exceptional 42.3% |
| Armenians | 99.2 /100 | #83 | Exceptional 42.3% |
| Immigrants | Western Asia | 99.2 /100 | #84 | Exceptional 42.3% |
| Lithuanians | 99.2 /100 | #85 | Exceptional 42.2% |
| Immigrants | Brazil | 99.2 /100 | #86 | Exceptional 42.2% |
| Carpatho Rusyns | 99.0 /100 | #87 | Exceptional 42.1% |
| Immigrants | Western Europe | 99.0 /100 | #88 | Exceptional 42.0% |
| Greeks | 99.0 /100 | #89 | Exceptional 42.0% |
| Laotians | 98.9 /100 | #90 | Exceptional 42.0% |
| Immigrants | Northern Africa | 98.9 /100 | #91 | Exceptional 41.9% |
| Maltese | 98.8 /100 | #92 | Exceptional 41.9% |
| Immigrants | Canada | 98.6 /100 | #93 | Exceptional 41.7% |
| Immigrants | Nepal | 98.6 /100 | #94 | Exceptional 41.7% |
| Immigrants | North America | 98.5 /100 | #95 | Exceptional 41.7% |
| Immigrants | Moldova | 98.4 /100 | #96 | Exceptional 41.6% |
Demographics Similar to U.S. Virgin Islanders by Bachelor's Degree
In terms of bachelor's degree, the demographic groups most similar to U.S. Virgin Islanders are Native Hawaiian (33.2%, a difference of 0.060%), Iroquois (33.2%, a difference of 0.080%), Immigrants from Bahamas (33.3%, a difference of 0.21%), Nicaraguan (33.1%, a difference of 0.27%), and Japanese (33.3%, a difference of 0.28%).
| Demographics | Rating | Rank | Bachelor's Degree |
| Jamaicans | 1.0 /100 | #246 | Tragic 33.6% |
| Immigrants | Congo | 1.0 /100 | #247 | Tragic 33.6% |
| Cree | 1.0 /100 | #248 | Tragic 33.6% |
| Immigrants | Liberia | 0.9 /100 | #249 | Tragic 33.5% |
| Indonesians | 0.9 /100 | #250 | Tragic 33.5% |
| Japanese | 0.7 /100 | #251 | Tragic 33.3% |
| Immigrants | Bahamas | 0.7 /100 | #252 | Tragic 33.3% |
| U.S. Virgin Islanders | 0.7 /100 | #253 | Tragic 33.2% |
| Native Hawaiians | 0.7 /100 | #254 | Tragic 33.2% |
| Iroquois | 0.7 /100 | #255 | Tragic 33.2% |
| Nicaraguans | 0.6 /100 | #256 | Tragic 33.1% |
| Spanish Americans | 0.6 /100 | #257 | Tragic 33.1% |
| French American Indians | 0.6 /100 | #258 | Tragic 33.1% |
| Osage | 0.5 /100 | #259 | Tragic 33.0% |
| Malaysians | 0.5 /100 | #260 | Tragic 32.9% |