Greek vs Chippewa Bachelor's Degree
COMPARE
Greek
Chippewa
Bachelor's Degree
Bachelor's Degree Comparison
Greeks
Chippewa
42.0%
BACHELOR'S DEGREE
99.0/ 100
METRIC RATING
89th/ 347
METRIC RANK
30.6%
BACHELOR'S DEGREE
0.0/ 100
METRIC RATING
298th/ 347
METRIC RANK
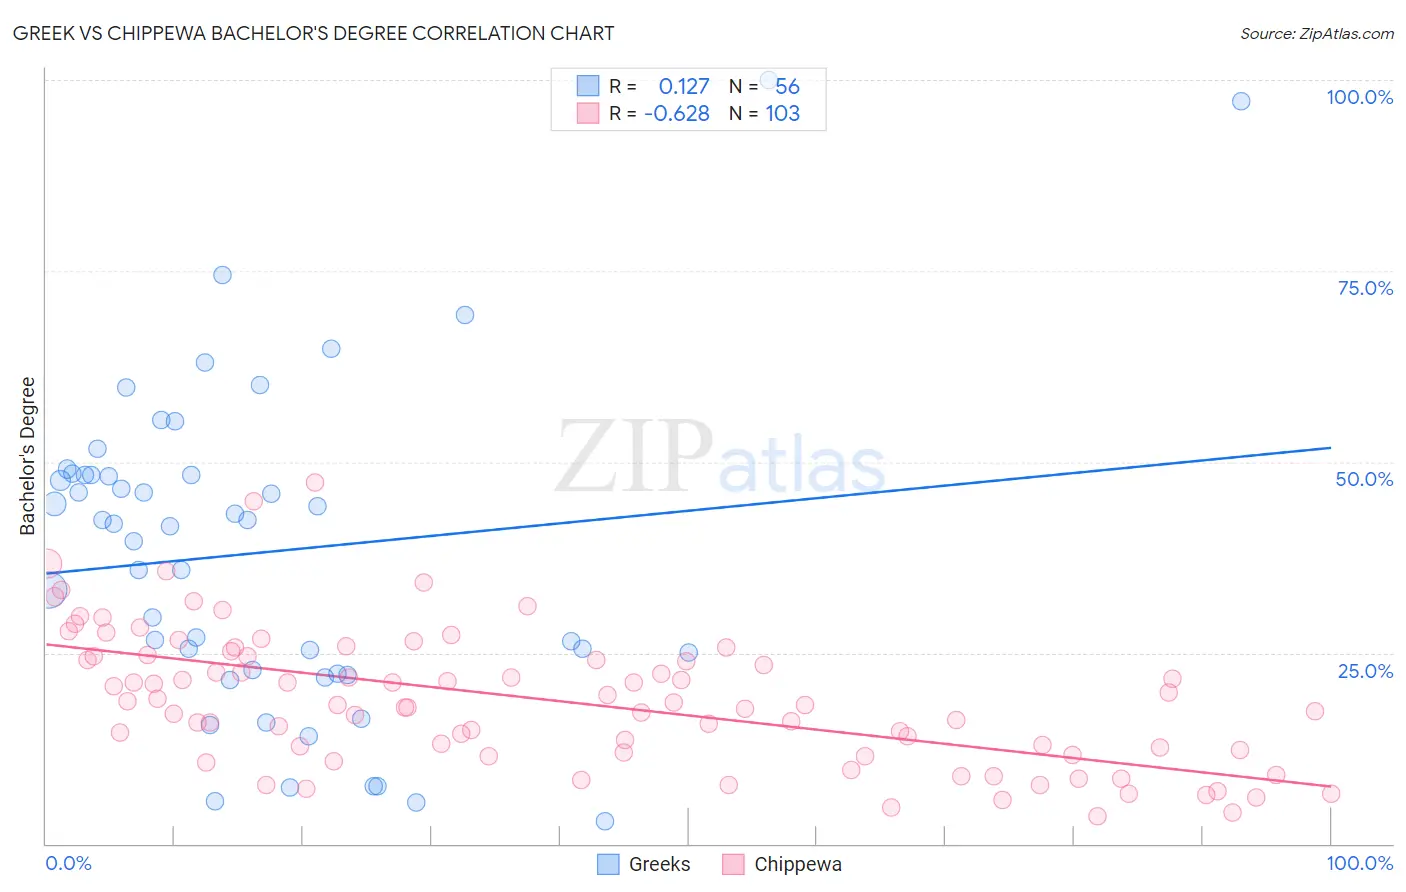
Greek vs Chippewa Bachelor's Degree Correlation Chart
The statistical analysis conducted on geographies consisting of 482,704,641 people shows a poor positive correlation between the proportion of Greeks and percentage of population with at least bachelor's degree education in the United States with a correlation coefficient (R) of 0.127 and weighted average of 42.0%. Similarly, the statistical analysis conducted on geographies consisting of 215,055,774 people shows a significant negative correlation between the proportion of Chippewa and percentage of population with at least bachelor's degree education in the United States with a correlation coefficient (R) of -0.628 and weighted average of 30.6%, a difference of 37.6%.
Bachelor's Degree Correlation Summary
| Measurement | Greek | Chippewa |
| Minimum | 2.9% | 3.6% |
| Maximum | 100.0% | 47.3% |
| Range | 97.1% | 43.7% |
| Mean | 38.2% | 18.8% |
| Median | 41.8% | 18.2% |
| Interquartile 25% (IQ1) | 22.6% | 12.0% |
| Interquartile 75% (IQ3) | 48.3% | 24.6% |
| Interquartile Range (IQR) | 25.8% | 12.6% |
| Standard Deviation (Sample) | 21.1% | 8.9% |
| Standard Deviation (Population) | 20.9% | 8.8% |
Similar Demographics by Bachelor's Degree
Demographics Similar to Greeks by Bachelor's Degree
In terms of bachelor's degree, the demographic groups most similar to Greeks are Immigrants from Western Europe (42.0%, a difference of 0.0%), Carpatho Rusyn (42.1%, a difference of 0.12%), Laotian (42.0%, a difference of 0.12%), Immigrants from Northern Africa (41.9%, a difference of 0.22%), and Maltese (41.9%, a difference of 0.30%).
| Demographics | Rating | Rank | Bachelor's Degree |
| Immigrants | Scotland | 99.2 /100 | #82 | Exceptional 42.3% |
| Armenians | 99.2 /100 | #83 | Exceptional 42.3% |
| Immigrants | Western Asia | 99.2 /100 | #84 | Exceptional 42.3% |
| Lithuanians | 99.2 /100 | #85 | Exceptional 42.2% |
| Immigrants | Brazil | 99.2 /100 | #86 | Exceptional 42.2% |
| Carpatho Rusyns | 99.0 /100 | #87 | Exceptional 42.1% |
| Immigrants | Western Europe | 99.0 /100 | #88 | Exceptional 42.0% |
| Greeks | 99.0 /100 | #89 | Exceptional 42.0% |
| Laotians | 98.9 /100 | #90 | Exceptional 42.0% |
| Immigrants | Northern Africa | 98.9 /100 | #91 | Exceptional 41.9% |
| Maltese | 98.8 /100 | #92 | Exceptional 41.9% |
| Immigrants | Canada | 98.6 /100 | #93 | Exceptional 41.7% |
| Immigrants | Nepal | 98.6 /100 | #94 | Exceptional 41.7% |
| Immigrants | North America | 98.5 /100 | #95 | Exceptional 41.7% |
| Immigrants | Moldova | 98.4 /100 | #96 | Exceptional 41.6% |
Demographics Similar to Chippewa by Bachelor's Degree
In terms of bachelor's degree, the demographic groups most similar to Chippewa are Immigrants from Haiti (30.6%, a difference of 0.25%), Puget Sound Salish (30.7%, a difference of 0.31%), Immigrants from Dominican Republic (30.7%, a difference of 0.41%), Chickasaw (30.4%, a difference of 0.52%), and Immigrants from Micronesia (30.4%, a difference of 0.54%).
| Demographics | Rating | Rank | Bachelor's Degree |
| Blacks/African Americans | 0.1 /100 | #291 | Tragic 30.9% |
| Ute | 0.1 /100 | #292 | Tragic 30.9% |
| Cape Verdeans | 0.1 /100 | #293 | Tragic 30.9% |
| Immigrants | Guatemala | 0.0 /100 | #294 | Tragic 30.8% |
| Immigrants | Dominican Republic | 0.0 /100 | #295 | Tragic 30.7% |
| Puget Sound Salish | 0.0 /100 | #296 | Tragic 30.7% |
| Immigrants | Haiti | 0.0 /100 | #297 | Tragic 30.6% |
| Chippewa | 0.0 /100 | #298 | Tragic 30.6% |
| Chickasaw | 0.0 /100 | #299 | Tragic 30.4% |
| Immigrants | Micronesia | 0.0 /100 | #300 | Tragic 30.4% |
| Immigrants | Cuba | 0.0 /100 | #301 | Tragic 30.3% |
| Mexican American Indians | 0.0 /100 | #302 | Tragic 30.2% |
| Bangladeshis | 0.0 /100 | #303 | Tragic 30.2% |
| Cherokee | 0.0 /100 | #304 | Tragic 30.2% |
| Immigrants | Latin America | 0.0 /100 | #305 | Tragic 30.1% |