Fijian vs Lumbee Bachelor's Degree
COMPARE
Fijian
Lumbee
Bachelor's Degree
Bachelor's Degree Comparison
Fijians
Lumbee
28.7%
BACHELOR'S DEGREE
0.0/ 100
METRIC RATING
323rd/ 347
METRIC RANK
24.8%
BACHELOR'S DEGREE
0.0/ 100
METRIC RATING
340th/ 347
METRIC RANK
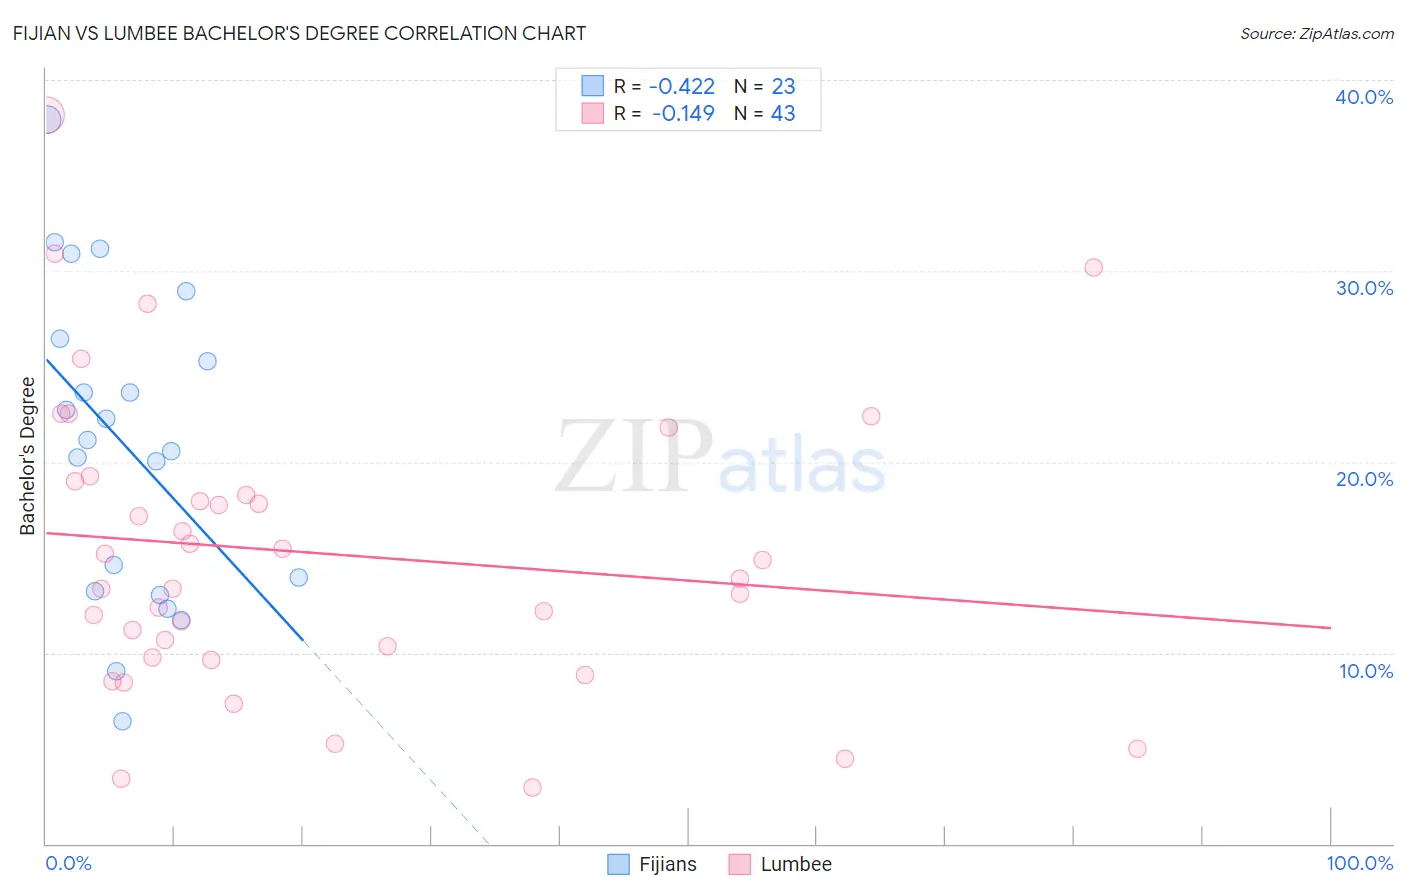
Fijian vs Lumbee Bachelor's Degree Correlation Chart
The statistical analysis conducted on geographies consisting of 55,947,282 people shows a moderate negative correlation between the proportion of Fijians and percentage of population with at least bachelor's degree education in the United States with a correlation coefficient (R) of -0.422 and weighted average of 28.7%. Similarly, the statistical analysis conducted on geographies consisting of 92,297,287 people shows a poor negative correlation between the proportion of Lumbee and percentage of population with at least bachelor's degree education in the United States with a correlation coefficient (R) of -0.149 and weighted average of 24.8%, a difference of 16.0%.
Bachelor's Degree Correlation Summary
| Measurement | Fijian | Lumbee |
| Minimum | 6.4% | 2.9% |
| Maximum | 37.9% | 38.2% |
| Range | 31.5% | 35.2% |
| Mean | 20.9% | 15.2% |
| Median | 21.2% | 13.9% |
| Interquartile 25% (IQ1) | 13.2% | 9.7% |
| Interquartile 75% (IQ3) | 26.5% | 19.0% |
| Interquartile Range (IQR) | 13.2% | 9.2% |
| Standard Deviation (Sample) | 8.2% | 7.7% |
| Standard Deviation (Population) | 8.0% | 7.6% |
Demographics Similar to Fijians and Lumbee by Bachelor's Degree
In terms of bachelor's degree, the demographic groups most similar to Fijians are Tsimshian (28.8%, a difference of 0.14%), Alaskan Athabascan (28.8%, a difference of 0.36%), Dutch West Indian (28.5%, a difference of 0.71%), Pennsylvania German (28.4%, a difference of 1.2%), and Apache (28.3%, a difference of 1.6%). Similarly, the demographic groups most similar to Lumbee are Yuman (24.5%, a difference of 0.92%), Hopi (25.3%, a difference of 2.2%), Pueblo (25.5%, a difference of 3.2%), Inupiat (25.8%, a difference of 4.3%), and Immigrants from Mexico (26.1%, a difference of 5.6%).
| Demographics | Rating | Rank | Bachelor's Degree |
| Alaskan Athabascans | 0.0 /100 | #321 | Tragic 28.8% |
| Tsimshian | 0.0 /100 | #322 | Tragic 28.8% |
| Fijians | 0.0 /100 | #323 | Tragic 28.7% |
| Dutch West Indians | 0.0 /100 | #324 | Tragic 28.5% |
| Pennsylvania Germans | 0.0 /100 | #325 | Tragic 28.4% |
| Apache | 0.0 /100 | #326 | Tragic 28.3% |
| Paiute | 0.0 /100 | #327 | Tragic 28.1% |
| Crow | 0.0 /100 | #328 | Tragic 27.7% |
| Immigrants | Central America | 0.0 /100 | #329 | Tragic 27.5% |
| Spanish American Indians | 0.0 /100 | #330 | Tragic 27.5% |
| Immigrants | Azores | 0.0 /100 | #331 | Tragic 27.3% |
| Menominee | 0.0 /100 | #332 | Tragic 27.3% |
| Mexicans | 0.0 /100 | #333 | Tragic 27.1% |
| Arapaho | 0.0 /100 | #334 | Tragic 26.6% |
| Natives/Alaskans | 0.0 /100 | #335 | Tragic 26.3% |
| Immigrants | Mexico | 0.0 /100 | #336 | Tragic 26.1% |
| Inupiat | 0.0 /100 | #337 | Tragic 25.8% |
| Pueblo | 0.0 /100 | #338 | Tragic 25.5% |
| Hopi | 0.0 /100 | #339 | Tragic 25.3% |
| Lumbee | 0.0 /100 | #340 | Tragic 24.8% |
| Yuman | 0.0 /100 | #341 | Tragic 24.5% |