Greek vs Korean College, 1 year or more
COMPARE
Greek
Korean
College, 1 year or more
College, 1 year or more Comparison
Greeks
Koreans
62.6%
COLLEGE, 1 YEAR OR MORE
98.3/ 100
METRIC RATING
88th/ 347
METRIC RANK
59.7%
COLLEGE, 1 YEAR OR MORE
58.5/ 100
METRIC RATING
162nd/ 347
METRIC RANK
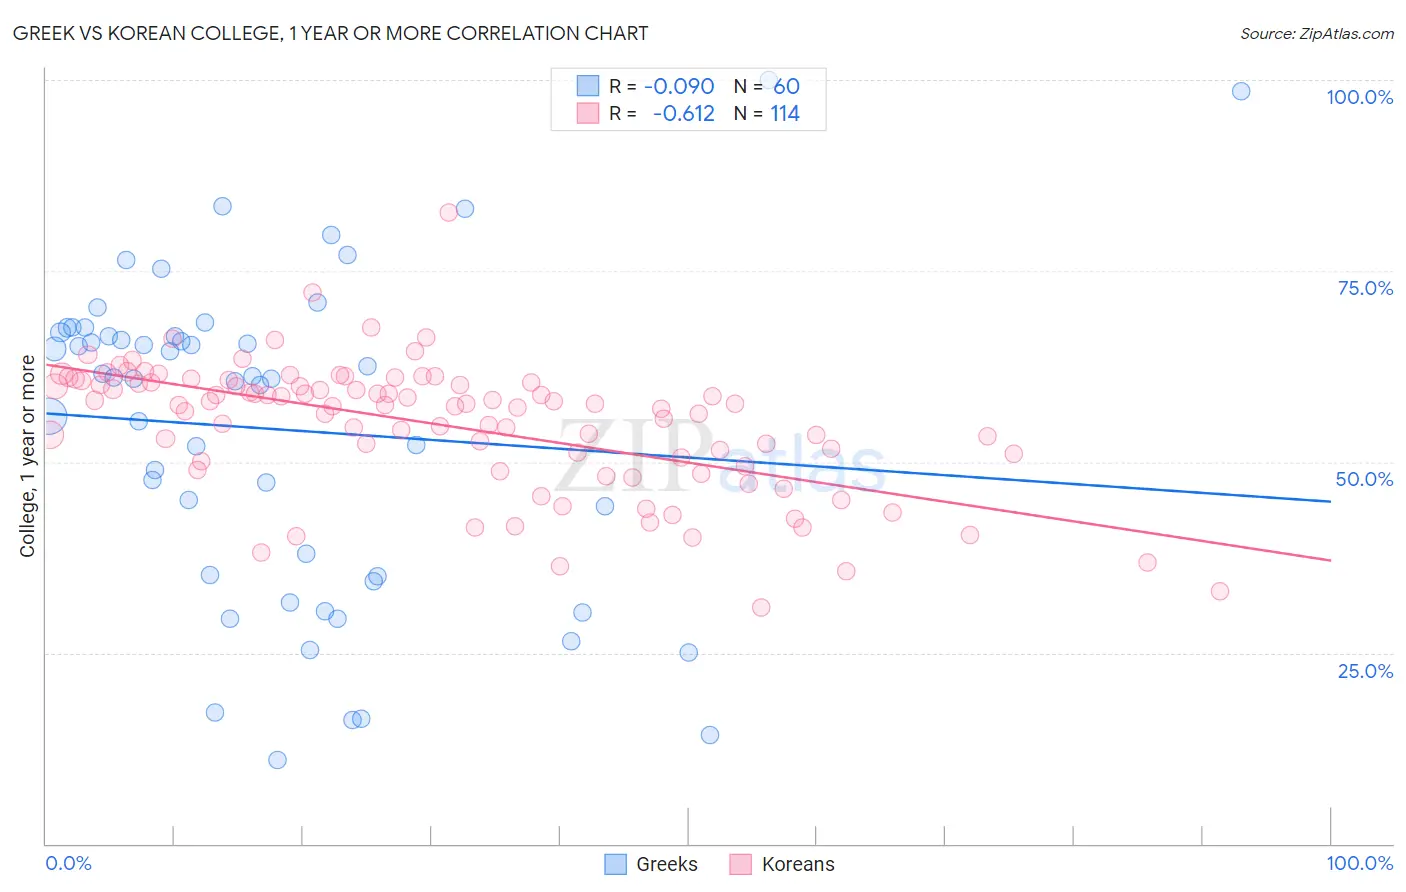
Greek vs Korean College, 1 year or more Correlation Chart
The statistical analysis conducted on geographies consisting of 482,770,265 people shows a slight negative correlation between the proportion of Greeks and percentage of population with at least college, 1 year or more education in the United States with a correlation coefficient (R) of -0.090 and weighted average of 62.6%. Similarly, the statistical analysis conducted on geographies consisting of 510,942,861 people shows a significant negative correlation between the proportion of Koreans and percentage of population with at least college, 1 year or more education in the United States with a correlation coefficient (R) of -0.612 and weighted average of 59.7%, a difference of 4.9%.
College, 1 year or more Correlation Summary
| Measurement | Greek | Korean |
| Minimum | 10.9% | 31.0% |
| Maximum | 100.0% | 82.6% |
| Range | 89.1% | 51.6% |
| Mean | 54.3% | 54.8% |
| Median | 61.0% | 57.4% |
| Interquartile 25% (IQ1) | 35.1% | 50.1% |
| Interquartile 75% (IQ3) | 66.7% | 60.4% |
| Interquartile Range (IQR) | 31.6% | 10.3% |
| Standard Deviation (Sample) | 20.9% | 8.5% |
| Standard Deviation (Population) | 20.8% | 8.5% |
Similar Demographics by College, 1 year or more
Demographics Similar to Greeks by College, 1 year or more
In terms of college, 1 year or more, the demographic groups most similar to Greeks are Immigrants from Ethiopia (62.6%, a difference of 0.10%), Immigrants from Hungary (62.7%, a difference of 0.17%), Immigrants from Western Europe (62.7%, a difference of 0.19%), Immigrants from Pakistan (62.8%, a difference of 0.21%), and Immigrants from England (62.8%, a difference of 0.22%).
| Demographics | Rating | Rank | College, 1 year or more |
| Laotians | 98.7 /100 | #81 | Exceptional 62.8% |
| Immigrants | Bolivia | 98.7 /100 | #82 | Exceptional 62.8% |
| Immigrants | Argentina | 98.6 /100 | #83 | Exceptional 62.8% |
| Immigrants | England | 98.6 /100 | #84 | Exceptional 62.8% |
| Immigrants | Pakistan | 98.6 /100 | #85 | Exceptional 62.8% |
| Immigrants | Western Europe | 98.6 /100 | #86 | Exceptional 62.7% |
| Immigrants | Hungary | 98.6 /100 | #87 | Exceptional 62.7% |
| Greeks | 98.3 /100 | #88 | Exceptional 62.6% |
| Immigrants | Ethiopia | 98.2 /100 | #89 | Exceptional 62.6% |
| Immigrants | Western Asia | 97.9 /100 | #90 | Exceptional 62.5% |
| Immigrants | Eastern Europe | 97.8 /100 | #91 | Exceptional 62.4% |
| Immigrants | Egypt | 97.8 /100 | #92 | Exceptional 62.4% |
| Romanians | 97.7 /100 | #93 | Exceptional 62.4% |
| Immigrants | Croatia | 97.6 /100 | #94 | Exceptional 62.3% |
| British | 97.4 /100 | #95 | Exceptional 62.3% |
Demographics Similar to Koreans by College, 1 year or more
In terms of college, 1 year or more, the demographic groups most similar to Koreans are Immigrants from Somalia (59.7%, a difference of 0.010%), Belgian (59.7%, a difference of 0.020%), Irish (59.6%, a difference of 0.13%), Immigrants from Africa (59.6%, a difference of 0.13%), and Immigrants from North Macedonia (59.5%, a difference of 0.29%).
| Demographics | Rating | Rank | College, 1 year or more |
| Moroccans | 72.9 /100 | #155 | Good 60.2% |
| Finns | 72.9 /100 | #156 | Good 60.2% |
| Immigrants | Armenia | 68.8 /100 | #157 | Good 60.0% |
| English | 67.2 /100 | #158 | Good 60.0% |
| Immigrants | Iraq | 67.0 /100 | #159 | Good 60.0% |
| South American Indians | 66.9 /100 | #160 | Good 60.0% |
| Somalis | 64.5 /100 | #161 | Good 59.9% |
| Koreans | 58.5 /100 | #162 | Average 59.7% |
| Immigrants | Somalia | 58.3 /100 | #163 | Average 59.7% |
| Belgians | 58.1 /100 | #164 | Average 59.7% |
| Irish | 56.1 /100 | #165 | Average 59.6% |
| Immigrants | Africa | 56.1 /100 | #166 | Average 59.6% |
| Immigrants | North Macedonia | 53.1 /100 | #167 | Average 59.5% |
| Hungarians | 52.9 /100 | #168 | Average 59.5% |
| Immigrants | Southern Europe | 52.7 /100 | #169 | Average 59.5% |