Ecuadorian vs Immigrants from Italy College, 1 year or more
COMPARE
Ecuadorian
Immigrants from Italy
College, 1 year or more
College, 1 year or more Comparison
Ecuadorians
Immigrants from Italy
54.3%
COLLEGE, 1 YEAR OR MORE
0.2/ 100
METRIC RATING
277th/ 347
METRIC RANK
61.2%
COLLEGE, 1 YEAR OR MORE
91.1/ 100
METRIC RATING
128th/ 347
METRIC RANK
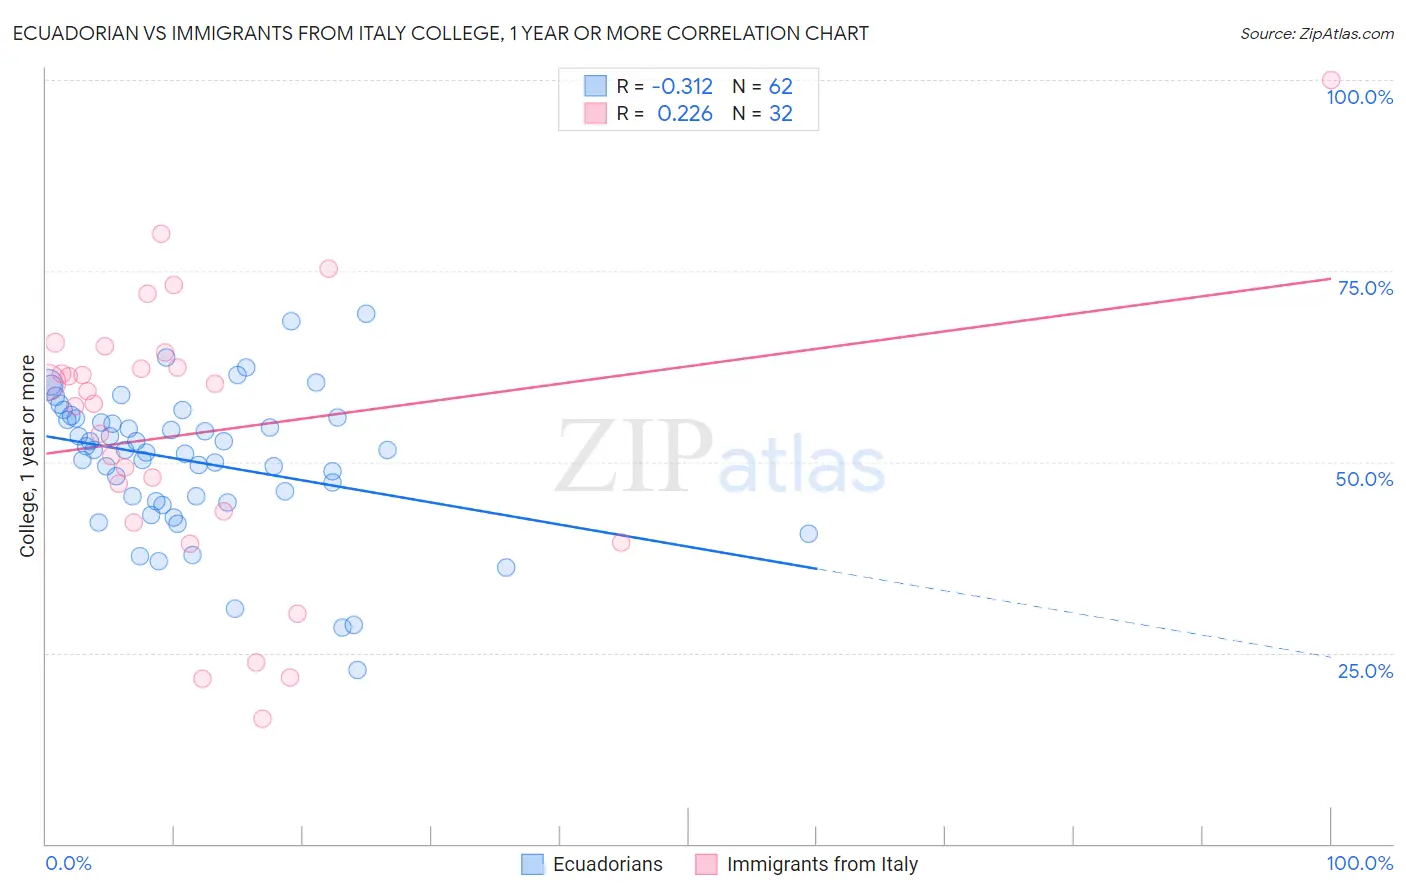
Ecuadorian vs Immigrants from Italy College, 1 year or more Correlation Chart
The statistical analysis conducted on geographies consisting of 317,865,755 people shows a mild negative correlation between the proportion of Ecuadorians and percentage of population with at least college, 1 year or more education in the United States with a correlation coefficient (R) of -0.312 and weighted average of 54.3%. Similarly, the statistical analysis conducted on geographies consisting of 324,223,988 people shows a weak positive correlation between the proportion of Immigrants from Italy and percentage of population with at least college, 1 year or more education in the United States with a correlation coefficient (R) of 0.226 and weighted average of 61.2%, a difference of 12.7%.
College, 1 year or more Correlation Summary
| Measurement | Ecuadorian | Immigrants from Italy |
| Minimum | 22.7% | 16.4% |
| Maximum | 69.4% | 100.0% |
| Range | 46.6% | 83.6% |
| Mean | 50.0% | 53.9% |
| Median | 51.5% | 58.4% |
| Interquartile 25% (IQ1) | 44.9% | 42.8% |
| Interquartile 75% (IQ3) | 55.7% | 63.3% |
| Interquartile Range (IQR) | 10.7% | 20.4% |
| Standard Deviation (Sample) | 9.3% | 18.4% |
| Standard Deviation (Population) | 9.2% | 18.1% |
Similar Demographics by College, 1 year or more
Demographics Similar to Ecuadorians by College, 1 year or more
In terms of college, 1 year or more, the demographic groups most similar to Ecuadorians are Shoshone (54.3%, a difference of 0.040%), American (54.4%, a difference of 0.12%), Belizean (54.4%, a difference of 0.15%), Immigrants from Grenada (54.4%, a difference of 0.19%), and Comanche (54.4%, a difference of 0.22%).
| Demographics | Rating | Rank | College, 1 year or more |
| Crow | 0.2 /100 | #270 | Tragic 54.5% |
| Bahamians | 0.2 /100 | #271 | Tragic 54.5% |
| Comanche | 0.2 /100 | #272 | Tragic 54.4% |
| Immigrants | Grenada | 0.2 /100 | #273 | Tragic 54.4% |
| Belizeans | 0.2 /100 | #274 | Tragic 54.4% |
| Americans | 0.2 /100 | #275 | Tragic 54.4% |
| Shoshone | 0.2 /100 | #276 | Tragic 54.3% |
| Ecuadorians | 0.2 /100 | #277 | Tragic 54.3% |
| Immigrants | Jamaica | 0.1 /100 | #278 | Tragic 54.2% |
| Arapaho | 0.1 /100 | #279 | Tragic 54.1% |
| Cheyenne | 0.1 /100 | #280 | Tragic 54.1% |
| Colville | 0.1 /100 | #281 | Tragic 54.1% |
| Guyanese | 0.1 /100 | #282 | Tragic 54.1% |
| Nicaraguans | 0.1 /100 | #283 | Tragic 53.9% |
| Ute | 0.1 /100 | #284 | Tragic 53.8% |
Demographics Similar to Immigrants from Italy by College, 1 year or more
In terms of college, 1 year or more, the demographic groups most similar to Immigrants from Italy are Immigrants from Eastern Africa (61.2%, a difference of 0.0%), Alsatian (61.3%, a difference of 0.030%), Ugandan (61.2%, a difference of 0.060%), Immigrants from Syria (61.3%, a difference of 0.080%), and Venezuelan (61.3%, a difference of 0.16%).
| Demographics | Rating | Rank | College, 1 year or more |
| Immigrants | Jordan | 92.7 /100 | #121 | Exceptional 61.4% |
| Immigrants | Chile | 92.3 /100 | #122 | Exceptional 61.4% |
| Serbians | 92.2 /100 | #123 | Exceptional 61.4% |
| Venezuelans | 92.1 /100 | #124 | Exceptional 61.3% |
| Immigrants | Syria | 91.6 /100 | #125 | Exceptional 61.3% |
| Alsatians | 91.3 /100 | #126 | Exceptional 61.3% |
| Immigrants | Eastern Africa | 91.1 /100 | #127 | Exceptional 61.2% |
| Immigrants | Italy | 91.1 /100 | #128 | Exceptional 61.2% |
| Ugandans | 90.7 /100 | #129 | Exceptional 61.2% |
| Italians | 89.5 /100 | #130 | Excellent 61.1% |
| Immigrants | Morocco | 89.5 /100 | #131 | Excellent 61.1% |
| Scandinavians | 88.2 /100 | #132 | Excellent 61.0% |
| Immigrants | Uzbekistan | 88.0 /100 | #133 | Excellent 61.0% |
| Immigrants | Venezuela | 87.9 /100 | #134 | Excellent 61.0% |
| Immigrants | Uganda | 87.4 /100 | #135 | Excellent 60.9% |