Greek vs Cherokee College, 1 year or more
COMPARE
Greek
Cherokee
College, 1 year or more
College, 1 year or more Comparison
Greeks
Cherokee
62.6%
COLLEGE, 1 YEAR OR MORE
98.3/ 100
METRIC RATING
88th/ 347
METRIC RANK
53.2%
COLLEGE, 1 YEAR OR MORE
0.0/ 100
METRIC RATING
294th/ 347
METRIC RANK
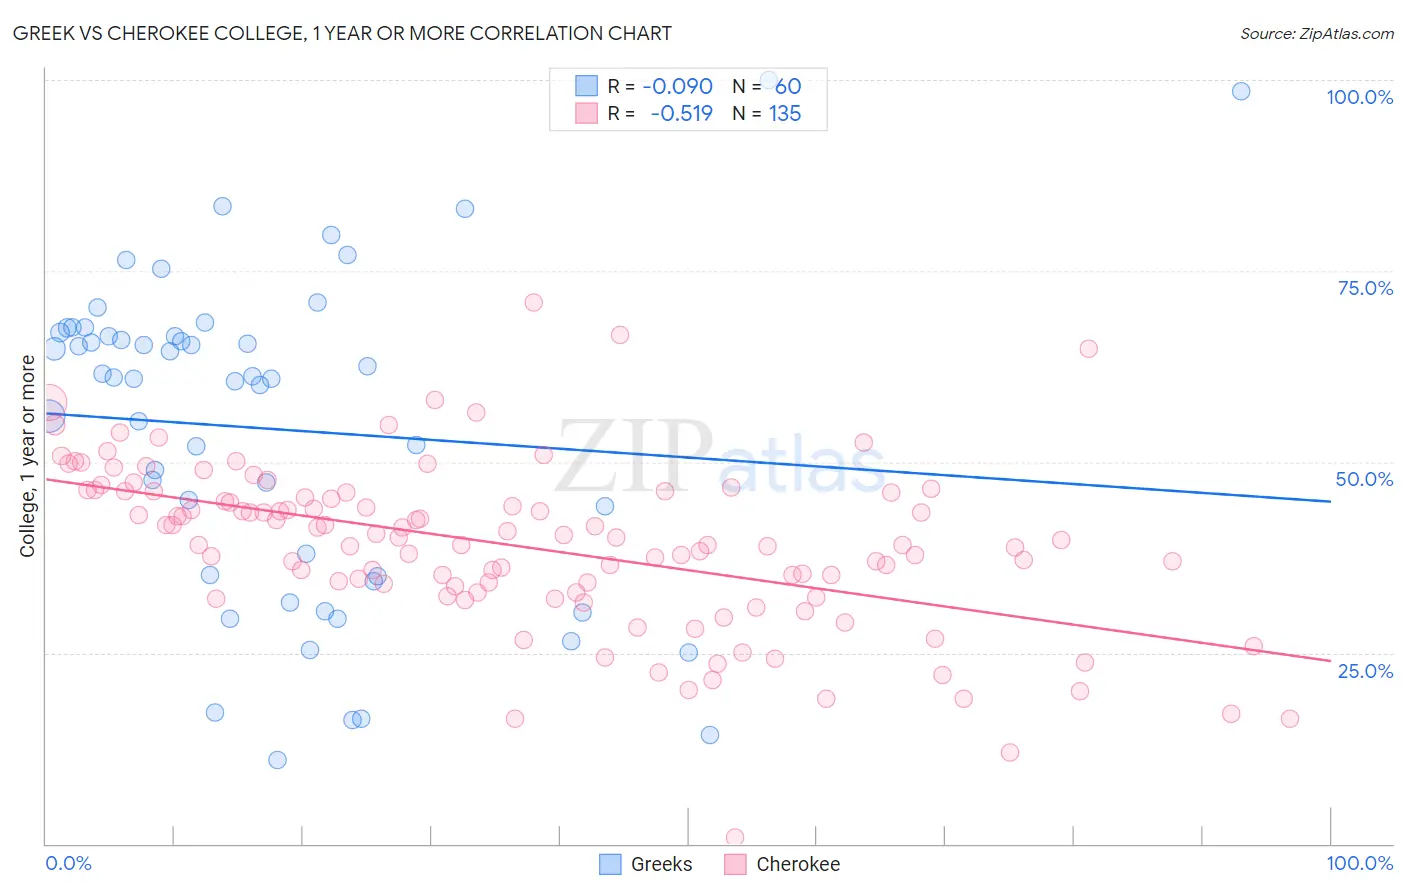
Greek vs Cherokee College, 1 year or more Correlation Chart
The statistical analysis conducted on geographies consisting of 482,770,265 people shows a slight negative correlation between the proportion of Greeks and percentage of population with at least college, 1 year or more education in the United States with a correlation coefficient (R) of -0.090 and weighted average of 62.6%. Similarly, the statistical analysis conducted on geographies consisting of 493,716,621 people shows a substantial negative correlation between the proportion of Cherokee and percentage of population with at least college, 1 year or more education in the United States with a correlation coefficient (R) of -0.519 and weighted average of 53.2%, a difference of 17.7%.
College, 1 year or more Correlation Summary
| Measurement | Greek | Cherokee |
| Minimum | 10.9% | 0.80% |
| Maximum | 100.0% | 70.9% |
| Range | 89.1% | 70.1% |
| Mean | 54.3% | 39.0% |
| Median | 61.0% | 39.7% |
| Interquartile 25% (IQ1) | 35.1% | 33.0% |
| Interquartile 75% (IQ3) | 66.7% | 46.0% |
| Interquartile Range (IQR) | 31.6% | 13.1% |
| Standard Deviation (Sample) | 20.9% | 10.9% |
| Standard Deviation (Population) | 20.8% | 10.9% |
Similar Demographics by College, 1 year or more
Demographics Similar to Greeks by College, 1 year or more
In terms of college, 1 year or more, the demographic groups most similar to Greeks are Immigrants from Ethiopia (62.6%, a difference of 0.10%), Immigrants from Hungary (62.7%, a difference of 0.17%), Immigrants from Western Europe (62.7%, a difference of 0.19%), Immigrants from Pakistan (62.8%, a difference of 0.21%), and Immigrants from England (62.8%, a difference of 0.22%).
| Demographics | Rating | Rank | College, 1 year or more |
| Laotians | 98.7 /100 | #81 | Exceptional 62.8% |
| Immigrants | Bolivia | 98.7 /100 | #82 | Exceptional 62.8% |
| Immigrants | Argentina | 98.6 /100 | #83 | Exceptional 62.8% |
| Immigrants | England | 98.6 /100 | #84 | Exceptional 62.8% |
| Immigrants | Pakistan | 98.6 /100 | #85 | Exceptional 62.8% |
| Immigrants | Western Europe | 98.6 /100 | #86 | Exceptional 62.7% |
| Immigrants | Hungary | 98.6 /100 | #87 | Exceptional 62.7% |
| Greeks | 98.3 /100 | #88 | Exceptional 62.6% |
| Immigrants | Ethiopia | 98.2 /100 | #89 | Exceptional 62.6% |
| Immigrants | Western Asia | 97.9 /100 | #90 | Exceptional 62.5% |
| Immigrants | Eastern Europe | 97.8 /100 | #91 | Exceptional 62.4% |
| Immigrants | Egypt | 97.8 /100 | #92 | Exceptional 62.4% |
| Romanians | 97.7 /100 | #93 | Exceptional 62.4% |
| Immigrants | Croatia | 97.6 /100 | #94 | Exceptional 62.3% |
| British | 97.4 /100 | #95 | Exceptional 62.3% |
Demographics Similar to Cherokee by College, 1 year or more
In terms of college, 1 year or more, the demographic groups most similar to Cherokee are Yaqui (53.2%, a difference of 0.010%), Black/African American (53.3%, a difference of 0.21%), Chickasaw (53.3%, a difference of 0.23%), Sioux (53.0%, a difference of 0.35%), and Cuban (53.4%, a difference of 0.36%).
| Demographics | Rating | Rank | College, 1 year or more |
| Immigrants | Belize | 0.1 /100 | #287 | Tragic 53.5% |
| Alaska Natives | 0.0 /100 | #288 | Tragic 53.4% |
| Immigrants | Ecuador | 0.0 /100 | #289 | Tragic 53.4% |
| Alaskan Athabascans | 0.0 /100 | #290 | Tragic 53.4% |
| Cubans | 0.0 /100 | #291 | Tragic 53.4% |
| Chickasaw | 0.0 /100 | #292 | Tragic 53.3% |
| Blacks/African Americans | 0.0 /100 | #293 | Tragic 53.3% |
| Cherokee | 0.0 /100 | #294 | Tragic 53.2% |
| Yaqui | 0.0 /100 | #295 | Tragic 53.2% |
| Sioux | 0.0 /100 | #296 | Tragic 53.0% |
| Paiute | 0.0 /100 | #297 | Tragic 52.9% |
| Immigrants | Dominica | 0.0 /100 | #298 | Tragic 52.5% |
| Immigrants | Nicaragua | 0.0 /100 | #299 | Tragic 52.4% |
| Choctaw | 0.0 /100 | #300 | Tragic 52.3% |
| Haitians | 0.0 /100 | #301 | Tragic 52.3% |