Greek vs Swedish Master's Degree

COMPARE

Greek
Race
Ancestry
AfghanAfricanAlaska NativeAlaskan AthabascanAlbanianAleutAlsatianAmericanApacheArabArapahoArgentineanArmenianAssyrian/Chaldean/SyriacAustralianAustrianBahamianBangladeshiBarbadianBasqueBelgianBelizeanBermudanBhutaneseBlackfeetBolivianBrazilianBritishBritish West IndianBulgarianBurmeseCajunCambodianCanadianCape VerdeanCarpatho RusynCelticCentral AmericanCentral American IndianCherokeeCheyenneChickasawChileanChineseChippewaChoctawColombianColvilleComancheCosta RicanCreeCreekCroatianCrowCubanCypriotCzechCzechoslovakianDanishDelawareDominicanDutchDutch West IndianEastern EuropeanEcuadorianEgyptianEnglishEstonianEthiopianEuropeanFijianFilipinoFinnishFrenchFrench American IndianFrench CanadianGermanGerman RussianGhanaianGreekGuamanian/ChamorroGuatemalanGuyaneseHaitianHmongHonduranHopiHoumaHungarianIcelanderIndian (Asian)IndonesianInupiatIranianIraqiIrishIroquoisIsraeliItalianJamaicanJapaneseJordanianKenyanKiowaKoreanLaotianLatvianLebaneseLiberianLithuanianLumbeeLuxembourgerMacedonianMalaysianMalteseMarshalleseMenomineeMexicanMexican American IndianMongolianMoroccanNative HawaiianNavajoNepaleseNew ZealanderNicaraguanNigerianNorthern EuropeanNorwegianOkinawanOsageOttawaPaiutePakistaniPalestinianPanamanianParaguayanPennsylvania GermanPeruvianPimaPolishPortuguesePotawatomiPuebloPuerto RicanPuget Sound SalishRomanianRussianSalvadoranSamoanScandinavianScotch-IrishScottishSeminoleSenegaleseSerbianShoshoneSierra LeoneanSiouxSlavicSlovakSloveneSomaliSouth AfricanSouth AmericanSouth American IndianSoviet UnionSpaniardSpanishSpanish AmericanSpanish American IndianSri LankanSubsaharan AfricanSudaneseSwissSyrianTaiwaneseThaiTlingit-HaidaTohono O'OdhamTonganTrinidadian and TobagonianTsimshianTurkishU.S. Virgin IslanderUgandanUkrainianUruguayanUteVenezuelanVietnameseWelshWest IndianYakamaYaquiYugoslavianYumanYup'ikZimbabwean
Immigration
NonimmigrantsImmigrantsAfghanistanAfricaAlbaniaArgentinaArmeniaAsiaAustraliaAustriaBahamasBangladeshBarbadosBelarusBelgiumBelizeBoliviaBosnia and HerzegovinaBrazilBulgariaBurma/MyanmarCabo VerdeCambodiaCameroonCanadaCaribbeanCentral AmericaChileChinaColombiaCongoCosta RicaCroatiaCubaCzechoslovakiaDenmarkDominicaDominican RepublicEastern AfricaEastern AsiaEastern EuropeEcuadorEgyptEl SalvadorEnglandEritreaEthiopiaEuropeFijiFranceGermanyGhanaGreeceGrenadaGuatemalaGuyanaHaitiHondurasHong KongHungaryIndiaIndonesiaIranIraqIrelandIsraelItalyJamaicaJapanJordanKazakhstanKenyaKoreaKuwaitLaosLatin AmericaLatviaLebanonLiberiaLithuaniaMalaysiaMexicoMicronesiaMiddle AfricaMoldovaMoroccoNepalNetherlandsNicaraguaNigeriaNorth AmericaNorth MacedoniaNorthern AfricaNorthern EuropeNorwayOceaniaPakistanPanamaPeruPhilippinesPolandPortugalRomaniaRussiaSaudi ArabiaScotlandSenegalSerbiaSierra LeoneSingaporeSomaliaSouth AfricaSouth AmericaSouth Central AsiaSouth Eastern AsiaSouthern EuropeSpainSri LankaSt. Vincent and the GrenadinesSudanSwedenSwitzerlandSyriaTaiwanThailandTrinidad and TobagoTurkeyUgandaUkraineUruguayUzbekistanVenezuelaVietnamWest IndiesWestern AfricaWestern AsiaWestern EuropeYemenZaireZimbabweAzores
Swedish
Race
Ancestry
AfghanAfricanAlaska NativeAlaskan AthabascanAlbanianAleutAlsatianAmericanApacheArabArapahoArgentineanArmenianAssyrian/Chaldean/SyriacAustralianAustrianBahamianBangladeshiBarbadianBasqueBelgianBelizeanBermudanBhutaneseBlackfeetBolivianBrazilianBritishBritish West IndianBulgarianBurmeseCajunCambodianCanadianCape VerdeanCarpatho RusynCelticCentral AmericanCentral American IndianCherokeeCheyenneChickasawChileanChineseChippewaChoctawColombianColvilleComancheCosta RicanCreeCreekCroatianCrowCubanCypriotCzechCzechoslovakianDanishDelawareDominicanDutchDutch West IndianEastern EuropeanEcuadorianEgyptianEnglishEstonianEthiopianEuropeanFijianFilipinoFinnishFrenchFrench American IndianFrench CanadianGermanGerman RussianGhanaianGuamanian/ChamorroGuatemalanGuyaneseHaitianHmongHonduranHopiHoumaHungarianIcelanderIndian (Asian)IndonesianInupiatIranianIraqiIrishIroquoisIsraeliItalianJamaicanJapaneseJordanianKenyanKiowaKoreanLaotianLatvianLebaneseLiberianLithuanianLumbeeLuxembourgerMacedonianMalaysianMalteseMarshalleseMenomineeMexicanMexican American IndianMongolianMoroccanNative HawaiianNavajoNepaleseNew ZealanderNicaraguanNigerianNorthern EuropeanNorwegianOkinawanOsageOttawaPaiutePakistaniPalestinianPanamanianParaguayanPennsylvania GermanPeruvianPimaPolishPortuguesePotawatomiPuebloPuerto RicanPuget Sound SalishRomanianRussianSalvadoranSamoanScandinavianScotch-IrishScottishSeminoleSenegaleseSerbianShoshoneSierra LeoneanSiouxSlavicSlovakSloveneSomaliSouth AfricanSouth AmericanSouth American IndianSoviet UnionSpaniardSpanishSpanish AmericanSpanish American IndianSri LankanSubsaharan AfricanSudaneseSwedishSwissSyrianTaiwaneseThaiTlingit-HaidaTohono O'OdhamTonganTrinidadian and TobagonianTsimshianTurkishU.S. Virgin IslanderUgandanUkrainianUruguayanUteVenezuelanVietnameseWelshWest IndianYakamaYaquiYugoslavianYumanYup'ikZimbabwean
Immigration
NonimmigrantsImmigrantsAfghanistanAfricaAlbaniaArgentinaArmeniaAsiaAustraliaAustriaBahamasBangladeshBarbadosBelarusBelgiumBelizeBoliviaBosnia and HerzegovinaBrazilBulgariaBurma/MyanmarCabo VerdeCambodiaCameroonCanadaCaribbeanCentral AmericaChileChinaColombiaCongoCosta RicaCroatiaCubaCzechoslovakiaDenmarkDominicaDominican RepublicEastern AfricaEastern AsiaEastern EuropeEcuadorEgyptEl SalvadorEnglandEritreaEthiopiaEuropeFijiFranceGermanyGhanaGreeceGrenadaGuatemalaGuyanaHaitiHondurasHong KongHungaryIndiaIndonesiaIranIraqIrelandIsraelItalyJamaicaJapanJordanKazakhstanKenyaKoreaKuwaitLaosLatin AmericaLatviaLebanonLiberiaLithuaniaMalaysiaMexicoMicronesiaMiddle AfricaMoldovaMoroccoNepalNetherlandsNicaraguaNigeriaNorth AmericaNorth MacedoniaNorthern AfricaNorthern EuropeNorwayOceaniaPakistanPanamaPeruPhilippinesPolandPortugalRomaniaRussiaSaudi ArabiaScotlandSenegalSerbiaSierra LeoneSingaporeSomaliaSouth AfricaSouth AmericaSouth Central AsiaSouth Eastern AsiaSouthern EuropeSpainSri LankaSt. Vincent and the GrenadinesSudanSwedenSwitzerlandSyriaTaiwanThailandTrinidad and TobagoTurkeyUgandaUkraineUruguayUzbekistanVenezuelaVietnamWest IndiesWestern AfricaWestern AsiaWestern EuropeYemenZaireZimbabweAzores
Master's Degree
Income
Poverty
Unemployment
Labor Participation
Family Structure
Vehicle Availability
Education Level
Disability

Master's Degree Comparison

Greeks

Swedes

Exceptional
Good
17.5%
MASTER'S DEGREE
99.5/ 100
METRIC RATING
82nd/ 347
METRIC RANK
15.2%
MASTER'S DEGREE
66.1/ 100
METRIC RATING
166th/ 347
METRIC RANK

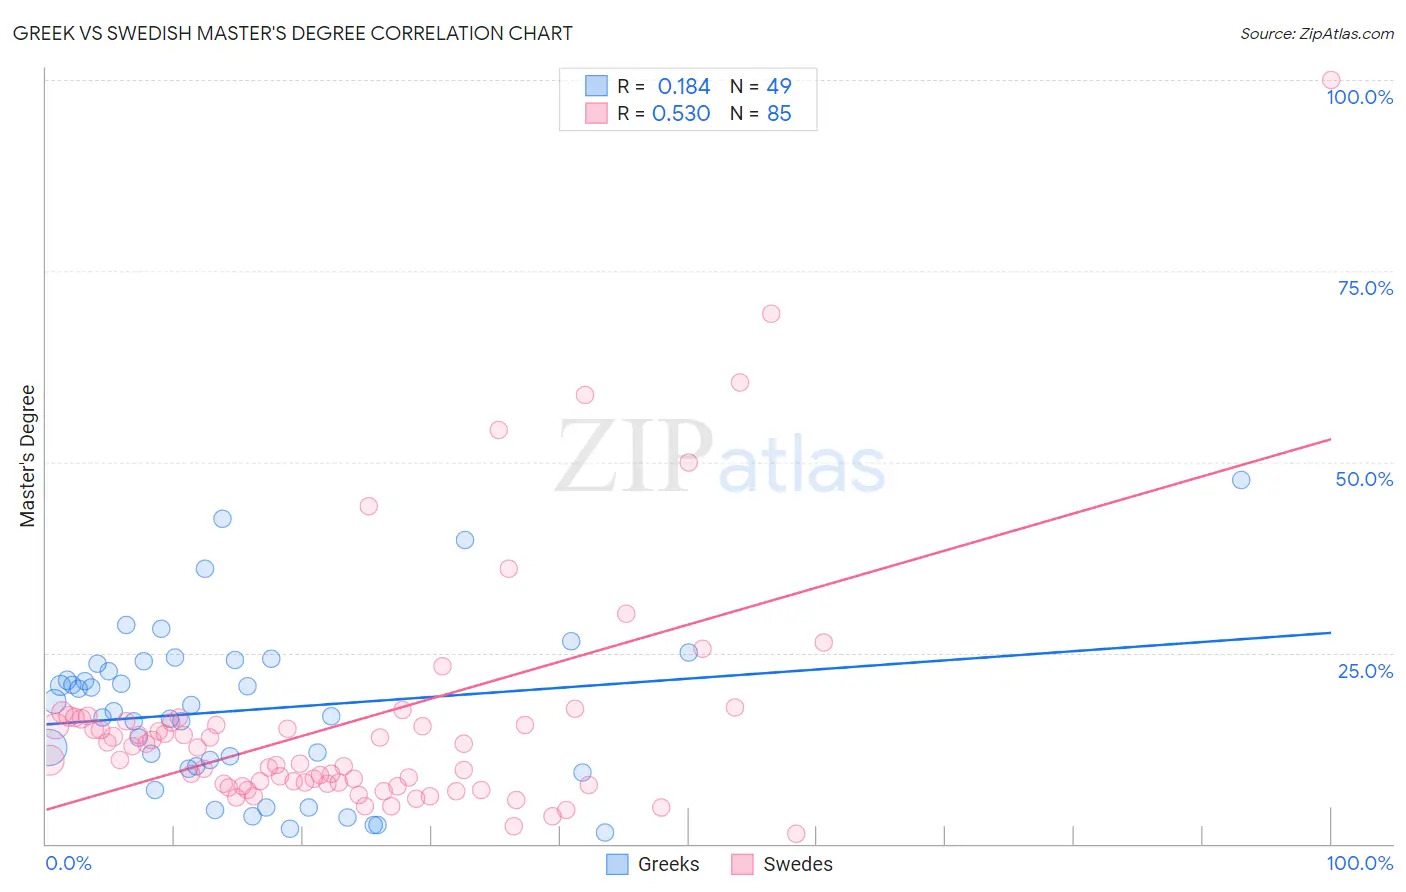
Greek vs Swedish Master's Degree Correlation Chart

The statistical analysis conducted on geographies consisting of 482,528,653 people shows a poor positive correlation between the proportion of Greeks and percentage of population with at least master's degree education in the United States with a correlation coefficient (R) of 0.184 and weighted average of 17.5%. Similarly, the statistical analysis conducted on geographies consisting of 538,720,356 people shows a substantial positive correlation between the proportion of Swedes and percentage of population with at least master's degree education in the United States with a correlation coefficient (R) of 0.530 and weighted average of 15.2%, a difference of 14.5%.
Greek vs Swedish Master's Degree

Master's Degree Correlation Summary

MeasurementGreekSwedish
Minimum1.5%1.3%
Maximum47.6%100.0%
Range46.1%98.7%
Mean17.5%16.0%
Median17.3%12.6%
Interquartile 25% (IQ1)10.0%7.7%
Interquartile 75% (IQ3)23.7%16.2%
Interquartile Range (IQR)13.7%8.5%
Standard Deviation (Sample)10.6%15.9%
Standard Deviation (Population)10.5%15.8%

Similar Demographics by Master's Degree

Demographics Similar to Greeks by Master's Degree

In terms of master's degree, the demographic groups most similar to Greeks are Immigrants from Western Asia (17.5%, a difference of 0.050%), Immigrants from Zimbabwe (17.4%, a difference of 0.050%), Carpatho Rusyn (17.5%, a difference of 0.35%), Immigrants from Scotland (17.4%, a difference of 0.39%), and Immigrants from Lebanon (17.5%, a difference of 0.40%).
DemographicsRating | RankMaster's Degree
Egyptians
99.6
/100
|
#75
Exceptional
17.6%
Immigrants | Indonesia
99.6
/100
|
#76
Exceptional
17.6%
Immigrants | Eastern Europe
99.6
/100
|
#77
Exceptional
17.6%
Immigrants | Hungary
99.6
/100
|
#78
Exceptional
17.5%
Immigrants | Lebanon
99.6
/100
|
#79
Exceptional
17.5%
Carpatho Rusyns
99.6
/100
|
#80
Exceptional
17.5%
Immigrants | Western Asia
99.5
/100
|
#81
Exceptional
17.5%
Greeks
99.5
/100
|
#82
Exceptional
17.5%
Immigrants | Zimbabwe
99.5
/100
|
#83
Exceptional
17.4%
Immigrants | Scotland
99.4
/100
|
#84
Exceptional
17.4%
Immigrants | Brazil
99.4
/100
|
#85
Exceptional
17.4%
Immigrants | Croatia
99.3
/100
|
#86
Exceptional
17.3%
Maltese
99.3
/100
|
#87
Exceptional
17.3%
Immigrants | Canada
99.2
/100
|
#88
Exceptional
17.2%
Bhutanese
99.1
/100
|
#89
Exceptional
17.2%

Demographics Similar to Swedes by Master's Degree

In terms of master's degree, the demographic groups most similar to Swedes are Immigrants from Kenya (15.3%, a difference of 0.070%), Senegalese (15.2%, a difference of 0.070%), Colombian (15.3%, a difference of 0.11%), Uruguayan (15.3%, a difference of 0.14%), and Immigrants from North Macedonia (15.2%, a difference of 0.22%).
DemographicsRating | RankMaster's Degree
Luxembourgers
71.0
/100
|
#159
Good
15.3%
Kenyans
70.3
/100
|
#160
Good
15.3%
Sudanese
68.7
/100
|
#161
Good
15.3%
Peruvians
68.7
/100
|
#162
Good
15.3%
Uruguayans
67.1
/100
|
#163
Good
15.3%
Colombians
66.9
/100
|
#164
Good
15.3%
Immigrants | Kenya
66.6
/100
|
#165
Good
15.3%
Swedes
66.1
/100
|
#166
Good
15.2%
Senegalese
65.6
/100
|
#167
Good
15.2%
Immigrants | North Macedonia
64.5
/100
|
#168
Good
15.2%
Scottish
62.7
/100
|
#169
Good
15.2%
Irish
56.3
/100
|
#170
Average
15.0%
Immigrants | Ghana
53.6
/100
|
#171
Average
15.0%
Immigrants | Uruguay
52.8
/100
|
#172
Average
15.0%
Costa Ricans
52.5
/100
|
#173
Average
15.0%