Greek vs Immigrants from Taiwan Master's Degree
COMPARE
Greek
Immigrants from Taiwan
Master's Degree
Master's Degree Comparison
Greeks
Immigrants from Taiwan
17.5%
MASTER'S DEGREE
99.5/ 100
METRIC RATING
82nd/ 347
METRIC RANK
22.5%
MASTER'S DEGREE
100.0/ 100
METRIC RATING
5th/ 347
METRIC RANK
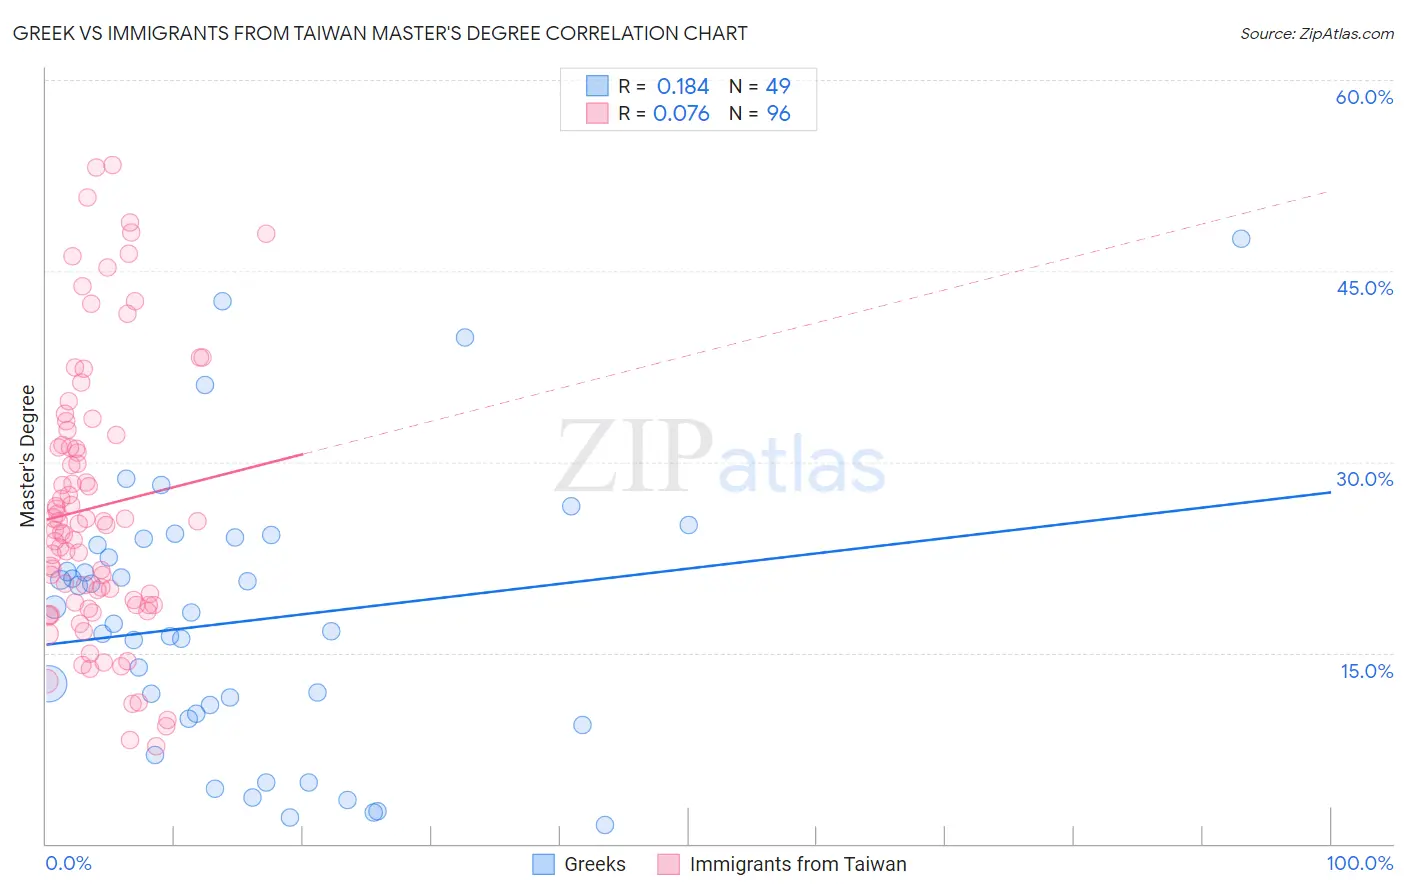
Greek vs Immigrants from Taiwan Master's Degree Correlation Chart
The statistical analysis conducted on geographies consisting of 482,528,653 people shows a poor positive correlation between the proportion of Greeks and percentage of population with at least master's degree education in the United States with a correlation coefficient (R) of 0.184 and weighted average of 17.5%. Similarly, the statistical analysis conducted on geographies consisting of 298,228,086 people shows a slight positive correlation between the proportion of Immigrants from Taiwan and percentage of population with at least master's degree education in the United States with a correlation coefficient (R) of 0.076 and weighted average of 22.5%, a difference of 28.7%.
Master's Degree Correlation Summary
| Measurement | Greek | Immigrants from Taiwan |
| Minimum | 1.5% | 7.7% |
| Maximum | 47.6% | 53.3% |
| Range | 46.1% | 45.6% |
| Mean | 17.5% | 26.4% |
| Median | 17.3% | 25.1% |
| Interquartile 25% (IQ1) | 10.0% | 18.8% |
| Interquartile 75% (IQ3) | 23.7% | 31.7% |
| Interquartile Range (IQR) | 13.7% | 13.0% |
| Standard Deviation (Sample) | 10.6% | 10.7% |
| Standard Deviation (Population) | 10.5% | 10.7% |
Similar Demographics by Master's Degree
Demographics Similar to Greeks by Master's Degree
In terms of master's degree, the demographic groups most similar to Greeks are Immigrants from Western Asia (17.5%, a difference of 0.050%), Immigrants from Zimbabwe (17.4%, a difference of 0.050%), Carpatho Rusyn (17.5%, a difference of 0.35%), Immigrants from Scotland (17.4%, a difference of 0.39%), and Immigrants from Lebanon (17.5%, a difference of 0.40%).
| Demographics | Rating | Rank | Master's Degree |
| Egyptians | 99.6 /100 | #75 | Exceptional 17.6% |
| Immigrants | Indonesia | 99.6 /100 | #76 | Exceptional 17.6% |
| Immigrants | Eastern Europe | 99.6 /100 | #77 | Exceptional 17.6% |
| Immigrants | Hungary | 99.6 /100 | #78 | Exceptional 17.5% |
| Immigrants | Lebanon | 99.6 /100 | #79 | Exceptional 17.5% |
| Carpatho Rusyns | 99.6 /100 | #80 | Exceptional 17.5% |
| Immigrants | Western Asia | 99.5 /100 | #81 | Exceptional 17.5% |
| Greeks | 99.5 /100 | #82 | Exceptional 17.5% |
| Immigrants | Zimbabwe | 99.5 /100 | #83 | Exceptional 17.4% |
| Immigrants | Scotland | 99.4 /100 | #84 | Exceptional 17.4% |
| Immigrants | Brazil | 99.4 /100 | #85 | Exceptional 17.4% |
| Immigrants | Croatia | 99.3 /100 | #86 | Exceptional 17.3% |
| Maltese | 99.3 /100 | #87 | Exceptional 17.3% |
| Immigrants | Canada | 99.2 /100 | #88 | Exceptional 17.2% |
| Bhutanese | 99.1 /100 | #89 | Exceptional 17.2% |
Demographics Similar to Immigrants from Taiwan by Master's Degree
In terms of master's degree, the demographic groups most similar to Immigrants from Taiwan are Immigrants from India (22.3%, a difference of 0.68%), Immigrants from Israel (22.6%, a difference of 0.80%), Okinawan (22.6%, a difference of 0.80%), Iranian (22.3%, a difference of 0.88%), and Cypriot (21.8%, a difference of 3.1%).
| Demographics | Rating | Rank | Master's Degree |
| Immigrants | Singapore | 100.0 /100 | #1 | Exceptional 23.4% |
| Filipinos | 100.0 /100 | #2 | Exceptional 23.4% |
| Immigrants | Israel | 100.0 /100 | #3 | Exceptional 22.6% |
| Okinawans | 100.0 /100 | #4 | Exceptional 22.6% |
| Immigrants | Taiwan | 100.0 /100 | #5 | Exceptional 22.5% |
| Immigrants | India | 100.0 /100 | #6 | Exceptional 22.3% |
| Iranians | 100.0 /100 | #7 | Exceptional 22.3% |
| Cypriots | 100.0 /100 | #8 | Exceptional 21.8% |
| Thais | 100.0 /100 | #9 | Exceptional 21.7% |
| Immigrants | Iran | 100.0 /100 | #10 | Exceptional 21.6% |
| Immigrants | China | 100.0 /100 | #11 | Exceptional 21.2% |
| Eastern Europeans | 100.0 /100 | #12 | Exceptional 21.1% |
| Immigrants | Australia | 100.0 /100 | #13 | Exceptional 20.9% |
| Immigrants | Switzerland | 100.0 /100 | #14 | Exceptional 20.9% |
| Immigrants | Eastern Asia | 100.0 /100 | #15 | Exceptional 20.8% |