Greek vs Immigrants from Eastern Asia Master's Degree
COMPARE
Greek
Immigrants from Eastern Asia
Master's Degree
Master's Degree Comparison
Greeks
Immigrants from Eastern Asia
17.5%
MASTER'S DEGREE
99.5/ 100
METRIC RATING
82nd/ 347
METRIC RANK
20.8%
MASTER'S DEGREE
100.0/ 100
METRIC RATING
15th/ 347
METRIC RANK
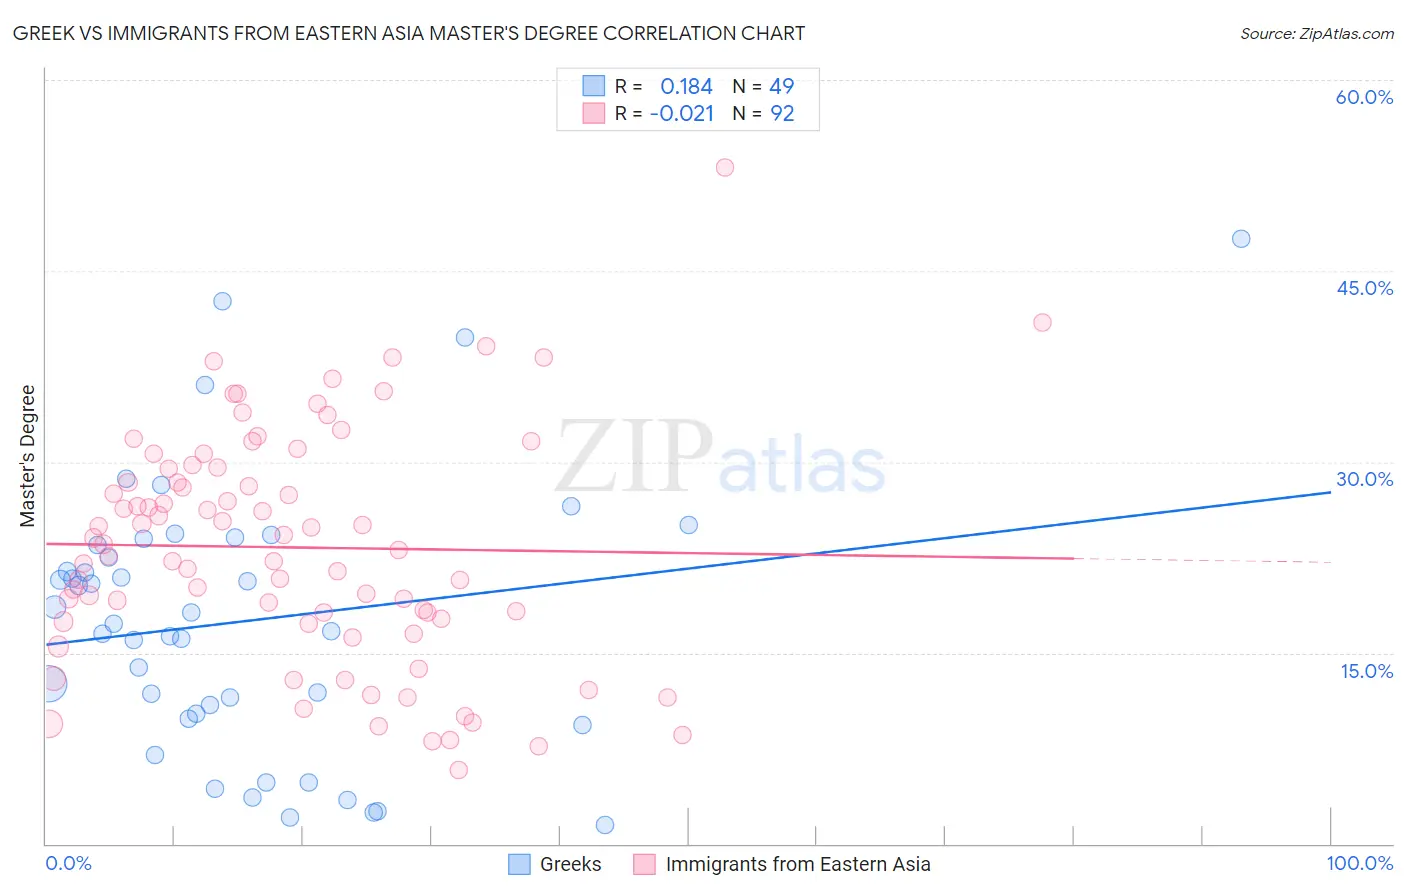
Greek vs Immigrants from Eastern Asia Master's Degree Correlation Chart
The statistical analysis conducted on geographies consisting of 482,528,653 people shows a poor positive correlation between the proportion of Greeks and percentage of population with at least master's degree education in the United States with a correlation coefficient (R) of 0.184 and weighted average of 17.5%. Similarly, the statistical analysis conducted on geographies consisting of 499,625,915 people shows no correlation between the proportion of Immigrants from Eastern Asia and percentage of population with at least master's degree education in the United States with a correlation coefficient (R) of -0.021 and weighted average of 20.8%, a difference of 19.4%.
Master's Degree Correlation Summary
| Measurement | Greek | Immigrants from Eastern Asia |
| Minimum | 1.5% | 5.8% |
| Maximum | 47.6% | 53.1% |
| Range | 46.1% | 47.3% |
| Mean | 17.5% | 23.3% |
| Median | 17.3% | 23.3% |
| Interquartile 25% (IQ1) | 10.0% | 17.6% |
| Interquartile 75% (IQ3) | 23.7% | 29.5% |
| Interquartile Range (IQR) | 13.7% | 11.9% |
| Standard Deviation (Sample) | 10.6% | 9.1% |
| Standard Deviation (Population) | 10.5% | 9.1% |
Similar Demographics by Master's Degree
Demographics Similar to Greeks by Master's Degree
In terms of master's degree, the demographic groups most similar to Greeks are Immigrants from Western Asia (17.5%, a difference of 0.050%), Immigrants from Zimbabwe (17.4%, a difference of 0.050%), Carpatho Rusyn (17.5%, a difference of 0.35%), Immigrants from Scotland (17.4%, a difference of 0.39%), and Immigrants from Lebanon (17.5%, a difference of 0.40%).
| Demographics | Rating | Rank | Master's Degree |
| Egyptians | 99.6 /100 | #75 | Exceptional 17.6% |
| Immigrants | Indonesia | 99.6 /100 | #76 | Exceptional 17.6% |
| Immigrants | Eastern Europe | 99.6 /100 | #77 | Exceptional 17.6% |
| Immigrants | Hungary | 99.6 /100 | #78 | Exceptional 17.5% |
| Immigrants | Lebanon | 99.6 /100 | #79 | Exceptional 17.5% |
| Carpatho Rusyns | 99.6 /100 | #80 | Exceptional 17.5% |
| Immigrants | Western Asia | 99.5 /100 | #81 | Exceptional 17.5% |
| Greeks | 99.5 /100 | #82 | Exceptional 17.5% |
| Immigrants | Zimbabwe | 99.5 /100 | #83 | Exceptional 17.4% |
| Immigrants | Scotland | 99.4 /100 | #84 | Exceptional 17.4% |
| Immigrants | Brazil | 99.4 /100 | #85 | Exceptional 17.4% |
| Immigrants | Croatia | 99.3 /100 | #86 | Exceptional 17.3% |
| Maltese | 99.3 /100 | #87 | Exceptional 17.3% |
| Immigrants | Canada | 99.2 /100 | #88 | Exceptional 17.2% |
| Bhutanese | 99.1 /100 | #89 | Exceptional 17.2% |
Demographics Similar to Immigrants from Eastern Asia by Master's Degree
In terms of master's degree, the demographic groups most similar to Immigrants from Eastern Asia are Immigrants from Switzerland (20.9%, a difference of 0.18%), Immigrants from Australia (20.9%, a difference of 0.19%), Immigrants from Belgium (20.8%, a difference of 0.29%), Immigrants from South Central Asia (20.7%, a difference of 0.54%), and Eastern European (21.1%, a difference of 1.4%).
| Demographics | Rating | Rank | Master's Degree |
| Cypriots | 100.0 /100 | #8 | Exceptional 21.8% |
| Thais | 100.0 /100 | #9 | Exceptional 21.7% |
| Immigrants | Iran | 100.0 /100 | #10 | Exceptional 21.6% |
| Immigrants | China | 100.0 /100 | #11 | Exceptional 21.2% |
| Eastern Europeans | 100.0 /100 | #12 | Exceptional 21.1% |
| Immigrants | Australia | 100.0 /100 | #13 | Exceptional 20.9% |
| Immigrants | Switzerland | 100.0 /100 | #14 | Exceptional 20.9% |
| Immigrants | Eastern Asia | 100.0 /100 | #15 | Exceptional 20.8% |
| Immigrants | Belgium | 100.0 /100 | #16 | Exceptional 20.8% |
| Immigrants | South Central Asia | 100.0 /100 | #17 | Exceptional 20.7% |
| Soviet Union | 100.0 /100 | #18 | Exceptional 20.5% |
| Immigrants | Hong Kong | 100.0 /100 | #19 | Exceptional 20.5% |
| Indians (Asian) | 100.0 /100 | #20 | Exceptional 20.5% |
| Immigrants | Ireland | 100.0 /100 | #21 | Exceptional 20.4% |
| Israelis | 100.0 /100 | #22 | Exceptional 20.3% |