Greek vs Portuguese Master's Degree
COMPARE
Greek
Portuguese
Master's Degree
Master's Degree Comparison
Greeks
Portuguese
17.5%
MASTER'S DEGREE
99.5/ 100
METRIC RATING
82nd/ 347
METRIC RANK
13.9%
MASTER'S DEGREE
11.2/ 100
METRIC RATING
225th/ 347
METRIC RANK
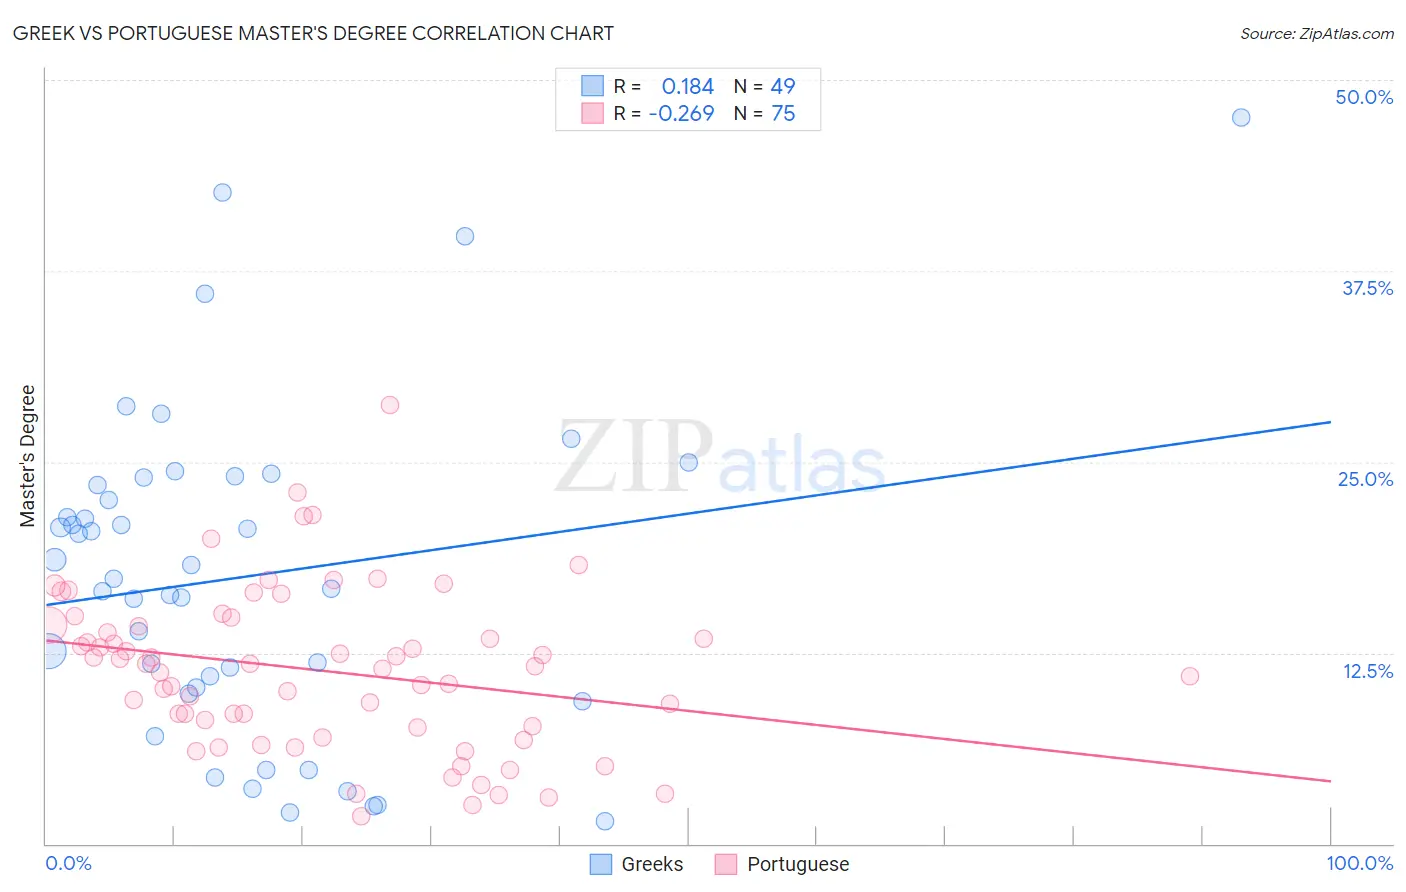
Greek vs Portuguese Master's Degree Correlation Chart
The statistical analysis conducted on geographies consisting of 482,528,653 people shows a poor positive correlation between the proportion of Greeks and percentage of population with at least master's degree education in the United States with a correlation coefficient (R) of 0.184 and weighted average of 17.5%. Similarly, the statistical analysis conducted on geographies consisting of 450,138,380 people shows a weak negative correlation between the proportion of Portuguese and percentage of population with at least master's degree education in the United States with a correlation coefficient (R) of -0.269 and weighted average of 13.9%, a difference of 25.3%.
Master's Degree Correlation Summary
| Measurement | Greek | Portuguese |
| Minimum | 1.5% | 1.8% |
| Maximum | 47.6% | 28.7% |
| Range | 46.1% | 26.9% |
| Mean | 17.5% | 11.3% |
| Median | 17.3% | 11.6% |
| Interquartile 25% (IQ1) | 10.0% | 7.6% |
| Interquartile 75% (IQ3) | 23.7% | 14.3% |
| Interquartile Range (IQR) | 13.7% | 6.7% |
| Standard Deviation (Sample) | 10.6% | 5.3% |
| Standard Deviation (Population) | 10.5% | 5.2% |
Similar Demographics by Master's Degree
Demographics Similar to Greeks by Master's Degree
In terms of master's degree, the demographic groups most similar to Greeks are Immigrants from Western Asia (17.5%, a difference of 0.050%), Immigrants from Zimbabwe (17.4%, a difference of 0.050%), Carpatho Rusyn (17.5%, a difference of 0.35%), Immigrants from Scotland (17.4%, a difference of 0.39%), and Immigrants from Lebanon (17.5%, a difference of 0.40%).
| Demographics | Rating | Rank | Master's Degree |
| Egyptians | 99.6 /100 | #75 | Exceptional 17.6% |
| Immigrants | Indonesia | 99.6 /100 | #76 | Exceptional 17.6% |
| Immigrants | Eastern Europe | 99.6 /100 | #77 | Exceptional 17.6% |
| Immigrants | Hungary | 99.6 /100 | #78 | Exceptional 17.5% |
| Immigrants | Lebanon | 99.6 /100 | #79 | Exceptional 17.5% |
| Carpatho Rusyns | 99.6 /100 | #80 | Exceptional 17.5% |
| Immigrants | Western Asia | 99.5 /100 | #81 | Exceptional 17.5% |
| Greeks | 99.5 /100 | #82 | Exceptional 17.5% |
| Immigrants | Zimbabwe | 99.5 /100 | #83 | Exceptional 17.4% |
| Immigrants | Scotland | 99.4 /100 | #84 | Exceptional 17.4% |
| Immigrants | Brazil | 99.4 /100 | #85 | Exceptional 17.4% |
| Immigrants | Croatia | 99.3 /100 | #86 | Exceptional 17.3% |
| Maltese | 99.3 /100 | #87 | Exceptional 17.3% |
| Immigrants | Canada | 99.2 /100 | #88 | Exceptional 17.2% |
| Bhutanese | 99.1 /100 | #89 | Exceptional 17.2% |
Demographics Similar to Portuguese by Master's Degree
In terms of master's degree, the demographic groups most similar to Portuguese are Immigrants from St. Vincent and the Grenadines (13.9%, a difference of 0.050%), Immigrants from Grenada (14.0%, a difference of 0.21%), Immigrants from South Eastern Asia (14.0%, a difference of 0.26%), Ecuadorian (14.0%, a difference of 0.46%), and Korean (14.0%, a difference of 0.49%).
| Demographics | Rating | Rank | Master's Degree |
| French Canadians | 14.9 /100 | #218 | Poor 14.1% |
| Norwegians | 13.6 /100 | #219 | Poor 14.0% |
| Germans | 13.1 /100 | #220 | Poor 14.0% |
| Koreans | 12.7 /100 | #221 | Poor 14.0% |
| Ecuadorians | 12.6 /100 | #222 | Poor 14.0% |
| Immigrants | South Eastern Asia | 11.9 /100 | #223 | Poor 14.0% |
| Immigrants | Grenada | 11.8 /100 | #224 | Poor 14.0% |
| Portuguese | 11.2 /100 | #225 | Poor 13.9% |
| Immigrants | St. Vincent and the Grenadines | 11.0 /100 | #226 | Poor 13.9% |
| Immigrants | West Indies | 9.8 /100 | #227 | Tragic 13.9% |
| Whites/Caucasians | 9.1 /100 | #228 | Tragic 13.8% |
| British West Indians | 8.8 /100 | #229 | Tragic 13.8% |
| Dutch | 8.7 /100 | #230 | Tragic 13.8% |
| Guyanese | 7.6 /100 | #231 | Tragic 13.7% |
| Immigrants | Philippines | 6.0 /100 | #232 | Tragic 13.6% |