Greek vs Austrian Professional Degree
COMPARE
Greek
Austrian
Professional Degree
Professional Degree Comparison
Greeks
Austrians
5.3%
PROFESSIONAL DEGREE
99.6/ 100
METRIC RATING
86th/ 347
METRIC RANK
5.2%
PROFESSIONAL DEGREE
99.1/ 100
METRIC RATING
98th/ 347
METRIC RANK
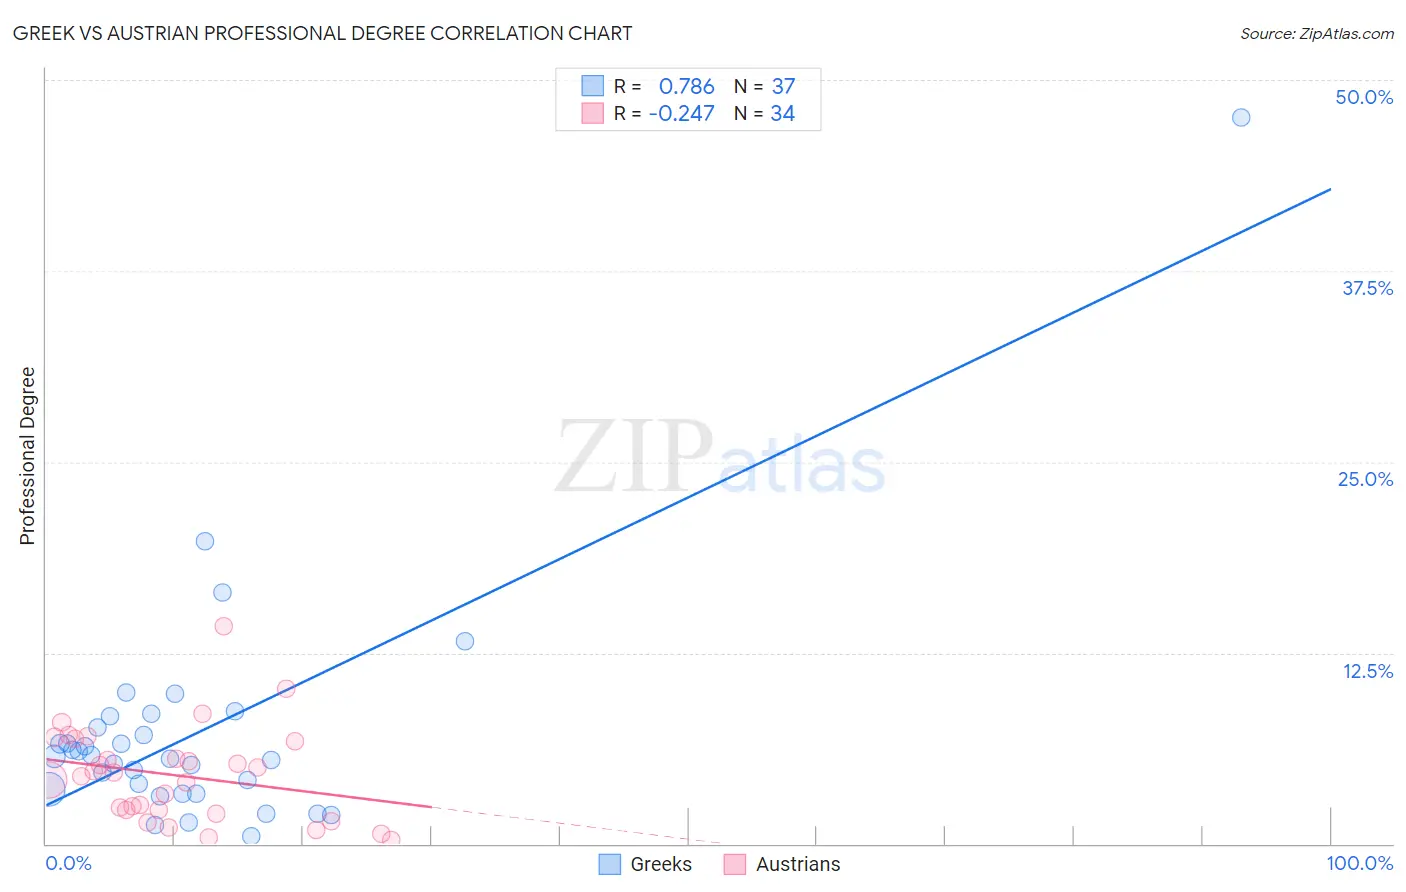
Greek vs Austrian Professional Degree Correlation Chart
The statistical analysis conducted on geographies consisting of 480,768,816 people shows a strong positive correlation between the proportion of Greeks and percentage of population with at least professional degree education in the United States with a correlation coefficient (R) of 0.786 and weighted average of 5.3%. Similarly, the statistical analysis conducted on geographies consisting of 450,559,334 people shows a weak negative correlation between the proportion of Austrians and percentage of population with at least professional degree education in the United States with a correlation coefficient (R) of -0.247 and weighted average of 5.2%, a difference of 2.2%.
Professional Degree Correlation Summary
| Measurement | Greek | Austrian |
| Minimum | 0.52% | 0.25% |
| Maximum | 47.6% | 14.3% |
| Range | 47.0% | 14.0% |
| Mean | 7.2% | 4.5% |
| Median | 5.7% | 4.5% |
| Interquartile 25% (IQ1) | 3.4% | 2.2% |
| Interquartile 75% (IQ3) | 8.0% | 6.7% |
| Interquartile Range (IQR) | 4.6% | 4.5% |
| Standard Deviation (Sample) | 7.9% | 3.1% |
| Standard Deviation (Population) | 7.8% | 3.0% |
Demographics Similar to Greeks and Austrians by Professional Degree
In terms of professional degree, the demographic groups most similar to Greeks are Immigrants from Zimbabwe (5.3%, a difference of 0.0%), Carpatho Rusyn (5.3%, a difference of 0.020%), Immigrants from Croatia (5.3%, a difference of 0.020%), Immigrants from Chile (5.3%, a difference of 0.11%), and Romanian (5.3%, a difference of 0.23%). Similarly, the demographic groups most similar to Austrians are Syrian (5.2%, a difference of 0.020%), Immigrants from Italy (5.2%, a difference of 0.060%), Immigrants from Uzbekistan (5.2%, a difference of 0.37%), Zimbabwean (5.2%, a difference of 0.78%), and Ugandan (5.1%, a difference of 0.82%).
| Demographics | Rating | Rank | Professional Degree |
| Romanians | 99.6 /100 | #82 | Exceptional 5.3% |
| Carpatho Rusyns | 99.6 /100 | #83 | Exceptional 5.3% |
| Immigrants | Croatia | 99.6 /100 | #84 | Exceptional 5.3% |
| Immigrants | Zimbabwe | 99.6 /100 | #85 | Exceptional 5.3% |
| Greeks | 99.6 /100 | #86 | Exceptional 5.3% |
| Immigrants | Chile | 99.5 /100 | #87 | Exceptional 5.3% |
| Egyptians | 99.5 /100 | #88 | Exceptional 5.3% |
| Chileans | 99.5 /100 | #89 | Exceptional 5.3% |
| Immigrants | Scotland | 99.5 /100 | #90 | Exceptional 5.3% |
| Laotians | 99.5 /100 | #91 | Exceptional 5.2% |
| Immigrants | Eastern Europe | 99.5 /100 | #92 | Exceptional 5.2% |
| Northern Europeans | 99.3 /100 | #93 | Exceptional 5.2% |
| Alsatians | 99.3 /100 | #94 | Exceptional 5.2% |
| Zimbabweans | 99.3 /100 | #95 | Exceptional 5.2% |
| Immigrants | Uzbekistan | 99.2 /100 | #96 | Exceptional 5.2% |
| Syrians | 99.1 /100 | #97 | Exceptional 5.2% |
| Austrians | 99.1 /100 | #98 | Exceptional 5.2% |
| Immigrants | Italy | 99.1 /100 | #99 | Exceptional 5.2% |
| Ugandans | 98.8 /100 | #100 | Exceptional 5.1% |
| Immigrants | Egypt | 98.5 /100 | #101 | Exceptional 5.1% |
| Ukrainians | 98.5 /100 | #102 | Exceptional 5.1% |