Immigrants from Northern Europe vs British West Indian Professional Degree
COMPARE
Immigrants from Northern Europe
British West Indian
Professional Degree
Professional Degree Comparison
Immigrants from Northern Europe
British West Indians
6.2%
PROFESSIONAL DEGREE
100.0/ 100
METRIC RATING
27th/ 347
METRIC RANK
3.8%
PROFESSIONAL DEGREE
2.4/ 100
METRIC RATING
239th/ 347
METRIC RANK
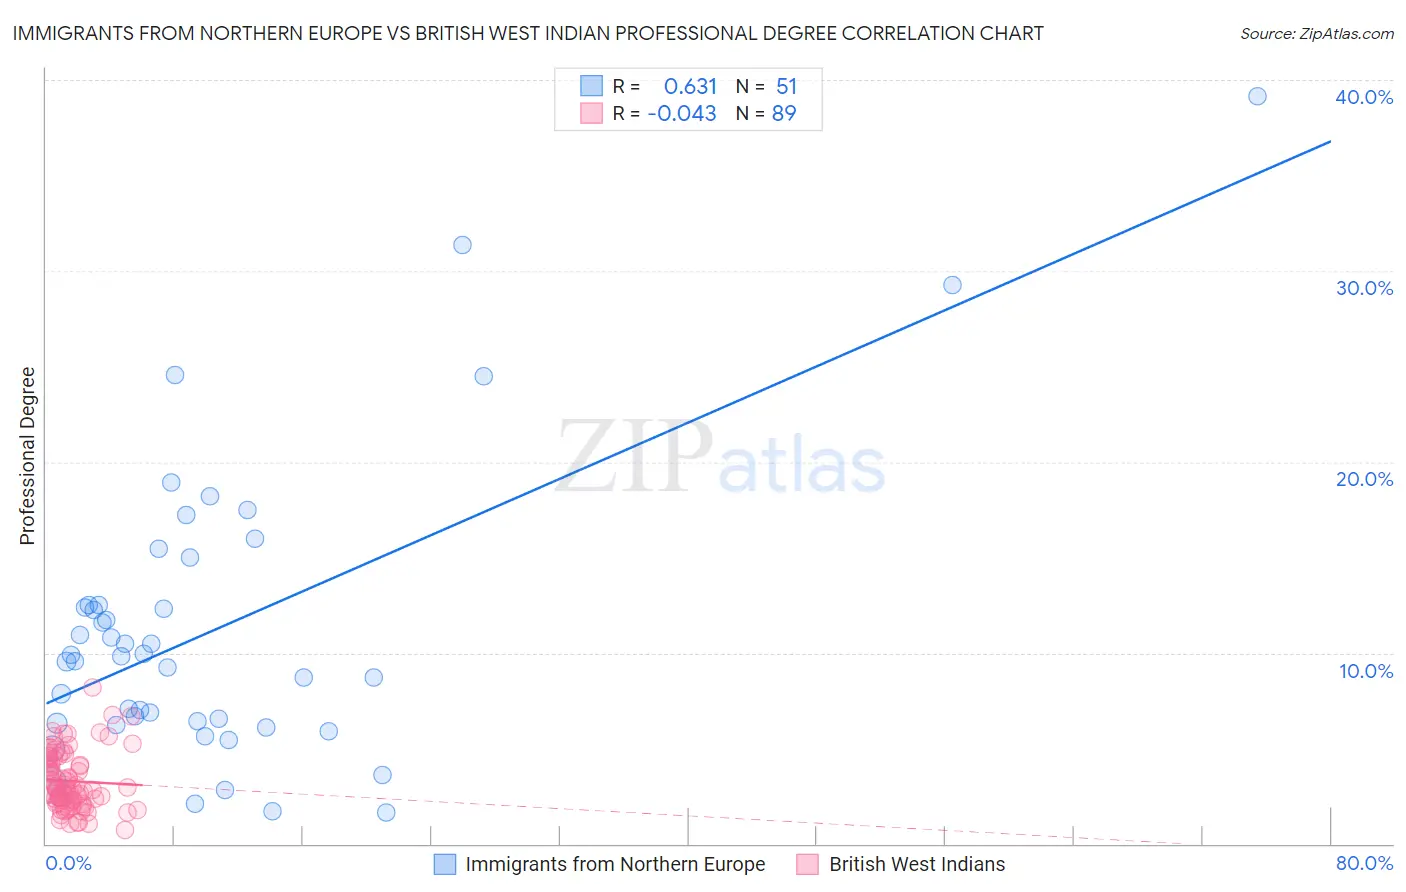
Immigrants from Northern Europe vs British West Indian Professional Degree Correlation Chart
The statistical analysis conducted on geographies consisting of 475,703,825 people shows a significant positive correlation between the proportion of Immigrants from Northern Europe and percentage of population with at least professional degree education in the United States with a correlation coefficient (R) of 0.631 and weighted average of 6.2%. Similarly, the statistical analysis conducted on geographies consisting of 152,575,254 people shows no correlation between the proportion of British West Indians and percentage of population with at least professional degree education in the United States with a correlation coefficient (R) of -0.043 and weighted average of 3.8%, a difference of 62.9%.
Professional Degree Correlation Summary
| Measurement | Immigrants from Northern Europe | British West Indian |
| Minimum | 1.7% | 0.74% |
| Maximum | 39.2% | 8.2% |
| Range | 37.5% | 7.4% |
| Mean | 11.3% | 3.3% |
| Median | 9.8% | 2.9% |
| Interquartile 25% (IQ1) | 6.3% | 2.1% |
| Interquartile 75% (IQ3) | 12.5% | 4.5% |
| Interquartile Range (IQR) | 6.2% | 2.3% |
| Standard Deviation (Sample) | 7.7% | 1.5% |
| Standard Deviation (Population) | 7.6% | 1.5% |
Similar Demographics by Professional Degree
Demographics Similar to Immigrants from Northern Europe by Professional Degree
In terms of professional degree, the demographic groups most similar to Immigrants from Northern Europe are Turkish (6.2%, a difference of 0.11%), Latvian (6.2%, a difference of 0.50%), Immigrants from Sri Lanka (6.2%, a difference of 0.75%), Immigrants from Turkey (6.2%, a difference of 0.75%), and Immigrants from India (6.2%, a difference of 0.87%).
| Demographics | Rating | Rank | Professional Degree |
| Immigrants | Denmark | 100.0 /100 | #20 | Exceptional 6.4% |
| Immigrants | Hong Kong | 100.0 /100 | #21 | Exceptional 6.4% |
| Immigrants | Japan | 100.0 /100 | #22 | Exceptional 6.4% |
| Russians | 100.0 /100 | #23 | Exceptional 6.3% |
| Immigrants | Spain | 100.0 /100 | #24 | Exceptional 6.3% |
| Immigrants | Ireland | 100.0 /100 | #25 | Exceptional 6.3% |
| Latvians | 100.0 /100 | #26 | Exceptional 6.2% |
| Immigrants | Northern Europe | 100.0 /100 | #27 | Exceptional 6.2% |
| Turks | 100.0 /100 | #28 | Exceptional 6.2% |
| Immigrants | Sri Lanka | 100.0 /100 | #29 | Exceptional 6.2% |
| Immigrants | Turkey | 100.0 /100 | #30 | Exceptional 6.2% |
| Immigrants | India | 100.0 /100 | #31 | Exceptional 6.2% |
| Thais | 100.0 /100 | #32 | Exceptional 6.1% |
| Burmese | 100.0 /100 | #33 | Exceptional 6.1% |
| Mongolians | 100.0 /100 | #34 | Exceptional 6.1% |
Demographics Similar to British West Indians by Professional Degree
In terms of professional degree, the demographic groups most similar to British West Indians are Immigrants from Ecuador (3.8%, a difference of 0.23%), Alaskan Athabascan (3.8%, a difference of 0.25%), Native Hawaiian (3.8%, a difference of 0.25%), Guamanian/Chamorro (3.8%, a difference of 0.33%), and Colville (3.8%, a difference of 0.39%).
| Demographics | Rating | Rank | Professional Degree |
| Cree | 4.3 /100 | #232 | Tragic 3.9% |
| Immigrants | Philippines | 4.1 /100 | #233 | Tragic 3.9% |
| Immigrants | Nonimmigrants | 4.0 /100 | #234 | Tragic 3.9% |
| Immigrants | Barbados | 4.0 /100 | #235 | Tragic 3.9% |
| Spanish Americans | 3.8 /100 | #236 | Tragic 3.9% |
| Immigrants | Trinidad and Tobago | 3.8 /100 | #237 | Tragic 3.9% |
| Colville | 2.6 /100 | #238 | Tragic 3.8% |
| British West Indians | 2.4 /100 | #239 | Tragic 3.8% |
| Immigrants | Ecuador | 2.3 /100 | #240 | Tragic 3.8% |
| Alaskan Athabascans | 2.3 /100 | #241 | Tragic 3.8% |
| Native Hawaiians | 2.3 /100 | #242 | Tragic 3.8% |
| Guamanians/Chamorros | 2.2 /100 | #243 | Tragic 3.8% |
| Immigrants | Bahamas | 2.0 /100 | #244 | Tragic 3.8% |
| French American Indians | 1.7 /100 | #245 | Tragic 3.8% |
| Marshallese | 1.7 /100 | #246 | Tragic 3.8% |