Greek vs Immigrants from Malaysia Professional Degree
COMPARE
Greek
Immigrants from Malaysia
Professional Degree
Professional Degree Comparison
Greeks
Immigrants from Malaysia
5.3%
PROFESSIONAL DEGREE
99.6/ 100
METRIC RATING
86th/ 347
METRIC RANK
5.7%
PROFESSIONAL DEGREE
100.0/ 100
METRIC RATING
56th/ 347
METRIC RANK
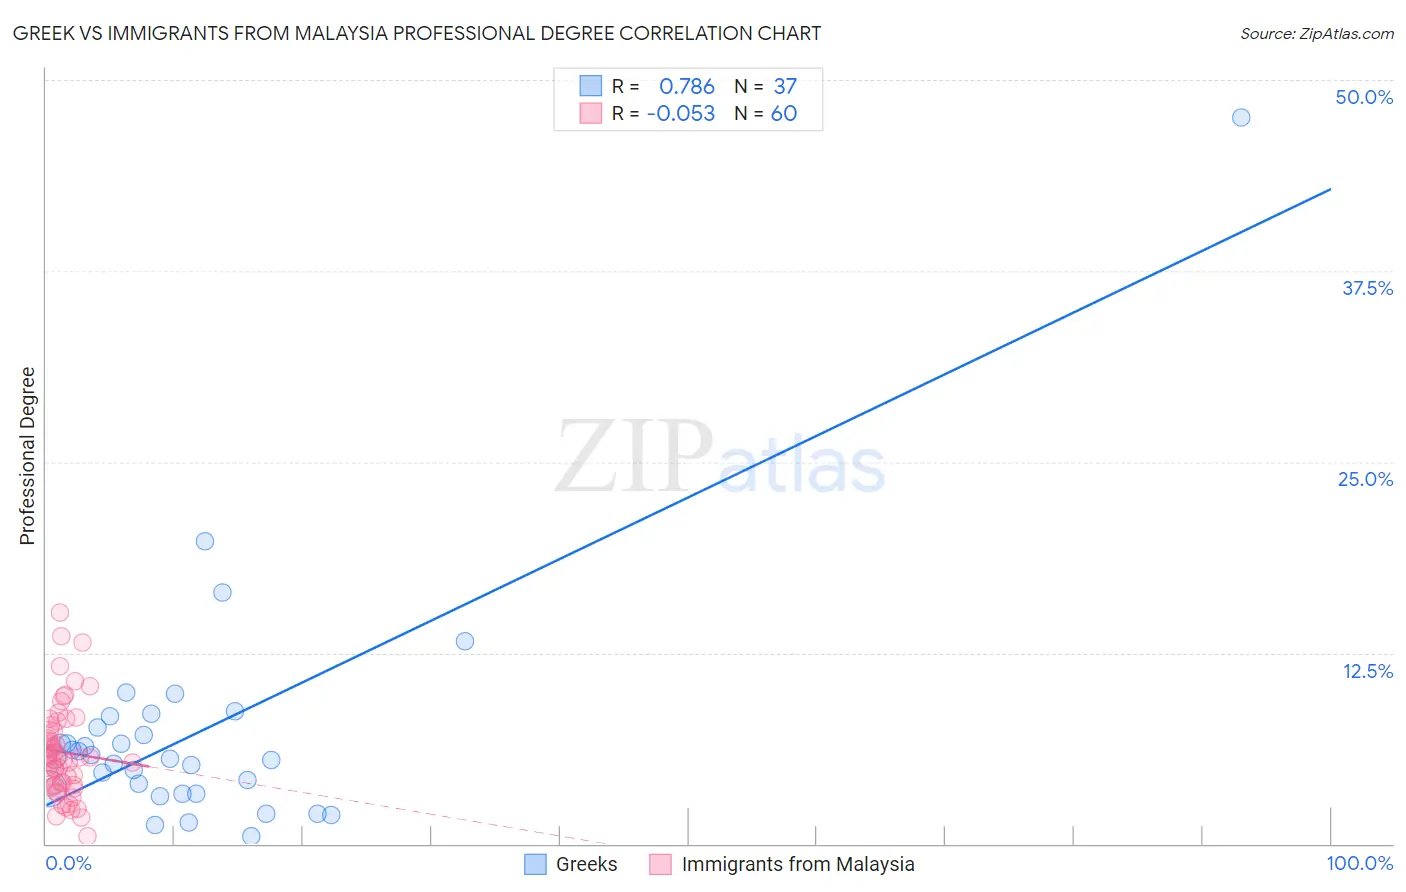
Greek vs Immigrants from Malaysia Professional Degree Correlation Chart
The statistical analysis conducted on geographies consisting of 480,768,816 people shows a strong positive correlation between the proportion of Greeks and percentage of population with at least professional degree education in the United States with a correlation coefficient (R) of 0.786 and weighted average of 5.3%. Similarly, the statistical analysis conducted on geographies consisting of 197,901,227 people shows a slight negative correlation between the proportion of Immigrants from Malaysia and percentage of population with at least professional degree education in the United States with a correlation coefficient (R) of -0.053 and weighted average of 5.7%, a difference of 8.4%.
Professional Degree Correlation Summary
| Measurement | Greek | Immigrants from Malaysia |
| Minimum | 0.52% | 0.51% |
| Maximum | 47.6% | 15.2% |
| Range | 47.0% | 14.6% |
| Mean | 7.2% | 6.0% |
| Median | 5.7% | 5.6% |
| Interquartile 25% (IQ1) | 3.4% | 3.8% |
| Interquartile 75% (IQ3) | 8.0% | 7.6% |
| Interquartile Range (IQR) | 4.6% | 3.8% |
| Standard Deviation (Sample) | 7.9% | 3.0% |
| Standard Deviation (Population) | 7.8% | 3.0% |
Similar Demographics by Professional Degree
Demographics Similar to Greeks by Professional Degree
In terms of professional degree, the demographic groups most similar to Greeks are Immigrants from Zimbabwe (5.3%, a difference of 0.0%), Carpatho Rusyn (5.3%, a difference of 0.020%), Immigrants from Croatia (5.3%, a difference of 0.020%), Immigrants from Chile (5.3%, a difference of 0.11%), and Romanian (5.3%, a difference of 0.23%).
| Demographics | Rating | Rank | Professional Degree |
| Immigrants | North America | 99.7 /100 | #79 | Exceptional 5.3% |
| Immigrants | England | 99.6 /100 | #80 | Exceptional 5.3% |
| Immigrants | Brazil | 99.6 /100 | #81 | Exceptional 5.3% |
| Romanians | 99.6 /100 | #82 | Exceptional 5.3% |
| Carpatho Rusyns | 99.6 /100 | #83 | Exceptional 5.3% |
| Immigrants | Croatia | 99.6 /100 | #84 | Exceptional 5.3% |
| Immigrants | Zimbabwe | 99.6 /100 | #85 | Exceptional 5.3% |
| Greeks | 99.6 /100 | #86 | Exceptional 5.3% |
| Immigrants | Chile | 99.5 /100 | #87 | Exceptional 5.3% |
| Egyptians | 99.5 /100 | #88 | Exceptional 5.3% |
| Chileans | 99.5 /100 | #89 | Exceptional 5.3% |
| Immigrants | Scotland | 99.5 /100 | #90 | Exceptional 5.3% |
| Laotians | 99.5 /100 | #91 | Exceptional 5.2% |
| Immigrants | Eastern Europe | 99.5 /100 | #92 | Exceptional 5.2% |
| Northern Europeans | 99.3 /100 | #93 | Exceptional 5.2% |
Demographics Similar to Immigrants from Malaysia by Professional Degree
In terms of professional degree, the demographic groups most similar to Immigrants from Malaysia are Immigrants from Western Europe (5.7%, a difference of 0.12%), South African (5.7%, a difference of 0.26%), Immigrants from Kuwait (5.7%, a difference of 0.52%), Bulgarian (5.7%, a difference of 0.86%), and Immigrants from Europe (5.6%, a difference of 1.4%).
| Demographics | Rating | Rank | Professional Degree |
| Immigrants | Latvia | 100.0 /100 | #49 | Exceptional 5.8% |
| Immigrants | Czechoslovakia | 100.0 /100 | #50 | Exceptional 5.8% |
| Immigrants | Greece | 100.0 /100 | #51 | Exceptional 5.8% |
| Immigrants | Serbia | 100.0 /100 | #52 | Exceptional 5.8% |
| Immigrants | Netherlands | 100.0 /100 | #53 | Exceptional 5.8% |
| Immigrants | Kuwait | 100.0 /100 | #54 | Exceptional 5.7% |
| Immigrants | Western Europe | 100.0 /100 | #55 | Exceptional 5.7% |
| Immigrants | Malaysia | 100.0 /100 | #56 | Exceptional 5.7% |
| South Africans | 100.0 /100 | #57 | Exceptional 5.7% |
| Bulgarians | 100.0 /100 | #58 | Exceptional 5.7% |
| Immigrants | Europe | 100.0 /100 | #59 | Exceptional 5.6% |
| Bolivians | 99.9 /100 | #60 | Exceptional 5.6% |
| Immigrants | Lithuania | 99.9 /100 | #61 | Exceptional 5.6% |
| Immigrants | Belarus | 99.9 /100 | #62 | Exceptional 5.5% |
| Asians | 99.9 /100 | #63 | Exceptional 5.5% |