Greek vs Eastern European Professional Degree
COMPARE
Greek
Eastern European
Professional Degree
Professional Degree Comparison
Greeks
Eastern Europeans
5.3%
PROFESSIONAL DEGREE
99.6/ 100
METRIC RATING
86th/ 347
METRIC RANK
7.1%
PROFESSIONAL DEGREE
100.0/ 100
METRIC RATING
7th/ 347
METRIC RANK
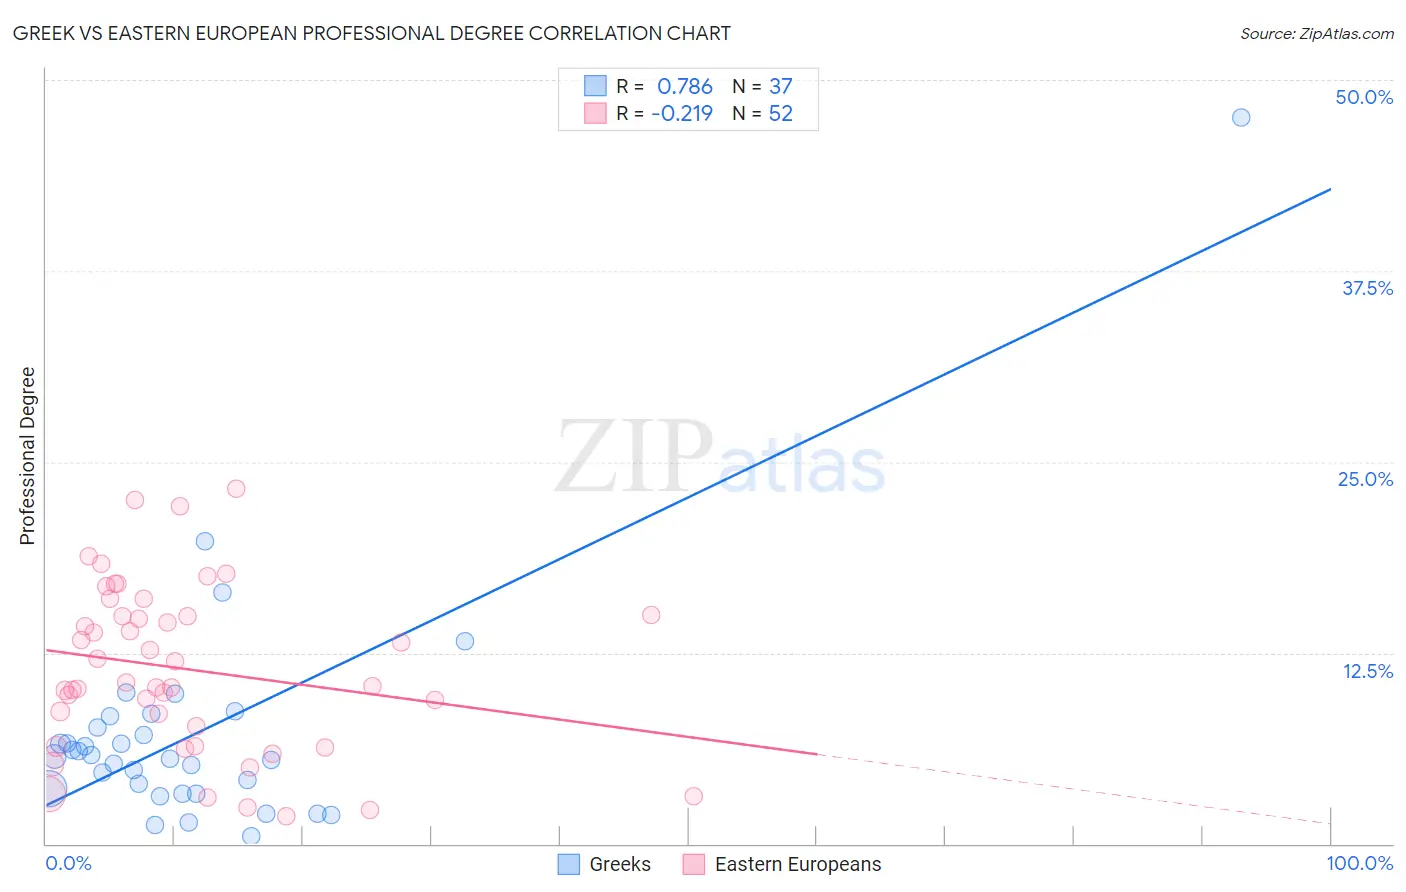
Greek vs Eastern European Professional Degree Correlation Chart
The statistical analysis conducted on geographies consisting of 480,768,816 people shows a strong positive correlation between the proportion of Greeks and percentage of population with at least professional degree education in the United States with a correlation coefficient (R) of 0.786 and weighted average of 5.3%. Similarly, the statistical analysis conducted on geographies consisting of 459,646,077 people shows a weak negative correlation between the proportion of Eastern Europeans and percentage of population with at least professional degree education in the United States with a correlation coefficient (R) of -0.219 and weighted average of 7.1%, a difference of 34.6%.
Professional Degree Correlation Summary
| Measurement | Greek | Eastern European |
| Minimum | 0.52% | 1.8% |
| Maximum | 47.6% | 23.2% |
| Range | 47.0% | 21.4% |
| Mean | 7.2% | 11.4% |
| Median | 5.7% | 10.5% |
| Interquartile 25% (IQ1) | 3.4% | 7.1% |
| Interquartile 75% (IQ3) | 8.0% | 14.9% |
| Interquartile Range (IQR) | 4.6% | 7.9% |
| Standard Deviation (Sample) | 7.9% | 5.4% |
| Standard Deviation (Population) | 7.8% | 5.4% |
Similar Demographics by Professional Degree
Demographics Similar to Greeks by Professional Degree
In terms of professional degree, the demographic groups most similar to Greeks are Immigrants from Zimbabwe (5.3%, a difference of 0.0%), Carpatho Rusyn (5.3%, a difference of 0.020%), Immigrants from Croatia (5.3%, a difference of 0.020%), Immigrants from Chile (5.3%, a difference of 0.11%), and Romanian (5.3%, a difference of 0.23%).
| Demographics | Rating | Rank | Professional Degree |
| Immigrants | North America | 99.7 /100 | #79 | Exceptional 5.3% |
| Immigrants | England | 99.6 /100 | #80 | Exceptional 5.3% |
| Immigrants | Brazil | 99.6 /100 | #81 | Exceptional 5.3% |
| Romanians | 99.6 /100 | #82 | Exceptional 5.3% |
| Carpatho Rusyns | 99.6 /100 | #83 | Exceptional 5.3% |
| Immigrants | Croatia | 99.6 /100 | #84 | Exceptional 5.3% |
| Immigrants | Zimbabwe | 99.6 /100 | #85 | Exceptional 5.3% |
| Greeks | 99.6 /100 | #86 | Exceptional 5.3% |
| Immigrants | Chile | 99.5 /100 | #87 | Exceptional 5.3% |
| Egyptians | 99.5 /100 | #88 | Exceptional 5.3% |
| Chileans | 99.5 /100 | #89 | Exceptional 5.3% |
| Immigrants | Scotland | 99.5 /100 | #90 | Exceptional 5.3% |
| Laotians | 99.5 /100 | #91 | Exceptional 5.2% |
| Immigrants | Eastern Europe | 99.5 /100 | #92 | Exceptional 5.2% |
| Northern Europeans | 99.3 /100 | #93 | Exceptional 5.2% |
Demographics Similar to Eastern Europeans by Professional Degree
In terms of professional degree, the demographic groups most similar to Eastern Europeans are Immigrants from Switzerland (7.1%, a difference of 0.14%), Immigrants from Taiwan (7.1%, a difference of 0.33%), Immigrants from Belgium (7.0%, a difference of 2.1%), Cypriot (6.9%, a difference of 2.2%), and Israeli (6.9%, a difference of 2.3%).
| Demographics | Rating | Rank | Professional Degree |
| Immigrants | Israel | 100.0 /100 | #1 | Exceptional 7.9% |
| Immigrants | Singapore | 100.0 /100 | #2 | Exceptional 7.7% |
| Iranians | 100.0 /100 | #3 | Exceptional 7.6% |
| Filipinos | 100.0 /100 | #4 | Exceptional 7.6% |
| Immigrants | Iran | 100.0 /100 | #5 | Exceptional 7.3% |
| Okinawans | 100.0 /100 | #6 | Exceptional 7.3% |
| Eastern Europeans | 100.0 /100 | #7 | Exceptional 7.1% |
| Immigrants | Switzerland | 100.0 /100 | #8 | Exceptional 7.1% |
| Immigrants | Taiwan | 100.0 /100 | #9 | Exceptional 7.1% |
| Immigrants | Belgium | 100.0 /100 | #10 | Exceptional 7.0% |
| Cypriots | 100.0 /100 | #11 | Exceptional 6.9% |
| Israelis | 100.0 /100 | #12 | Exceptional 6.9% |
| Immigrants | Australia | 100.0 /100 | #13 | Exceptional 6.9% |
| Immigrants | France | 100.0 /100 | #14 | Exceptional 6.8% |
| Immigrants | China | 100.0 /100 | #15 | Exceptional 6.7% |