Immigrants from South America vs African Professional Degree
COMPARE
Immigrants from South America
African
Professional Degree
Professional Degree Comparison
Immigrants from South America
Africans
4.6%
PROFESSIONAL DEGREE
80.5/ 100
METRIC RATING
144th/ 347
METRIC RANK
3.7%
PROFESSIONAL DEGREE
1.0/ 100
METRIC RATING
259th/ 347
METRIC RANK
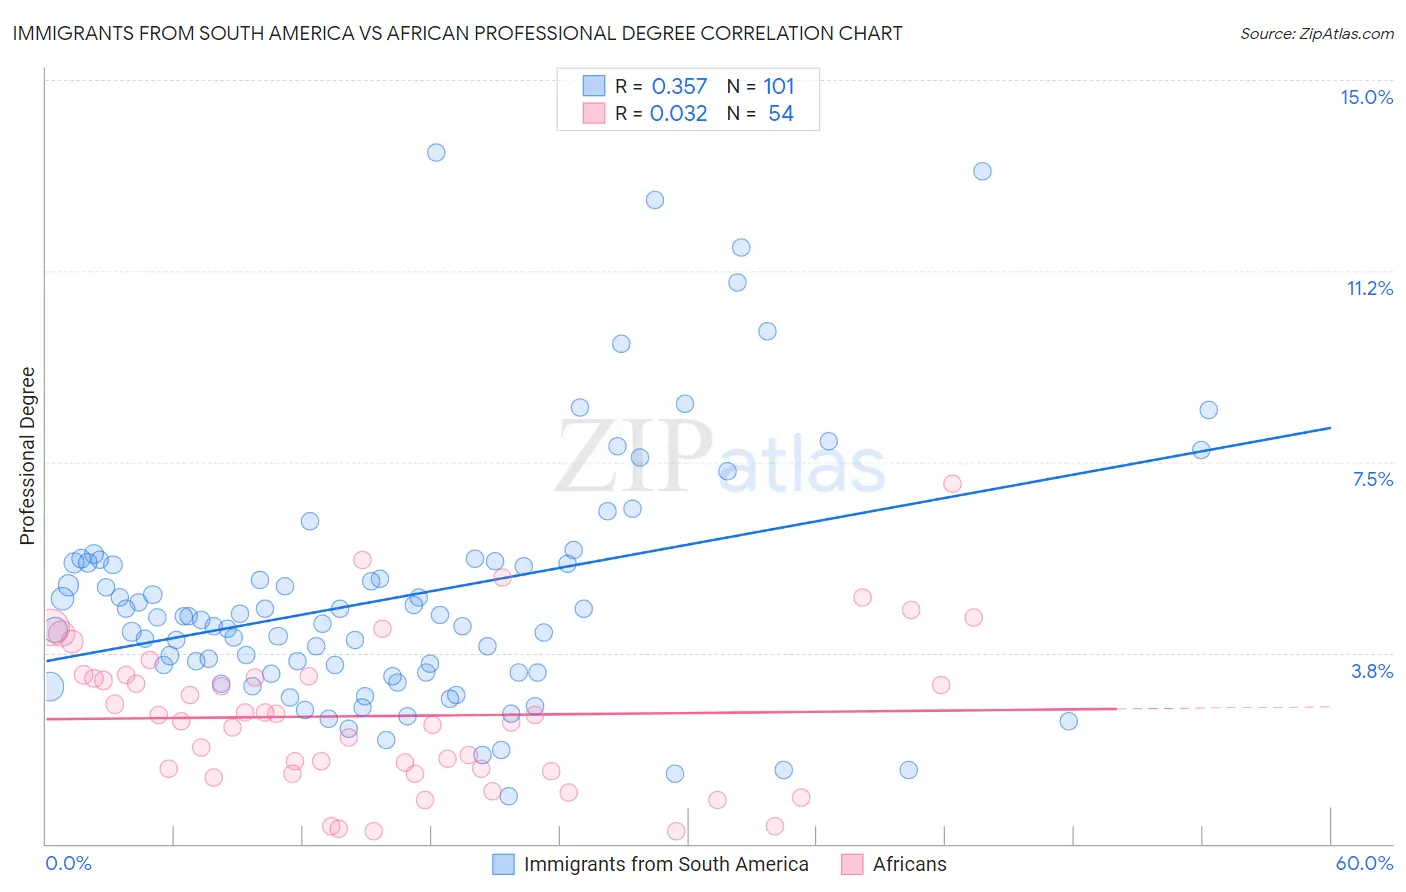
Immigrants from South America vs African Professional Degree Correlation Chart
The statistical analysis conducted on geographies consisting of 484,634,424 people shows a mild positive correlation between the proportion of Immigrants from South America and percentage of population with at least professional degree education in the United States with a correlation coefficient (R) of 0.357 and weighted average of 4.6%. Similarly, the statistical analysis conducted on geographies consisting of 467,688,066 people shows no correlation between the proportion of Africans and percentage of population with at least professional degree education in the United States with a correlation coefficient (R) of 0.032 and weighted average of 3.7%, a difference of 26.2%.
Professional Degree Correlation Summary
| Measurement | Immigrants from South America | African |
| Minimum | 0.92% | 0.23% |
| Maximum | 13.6% | 7.1% |
| Range | 12.6% | 6.8% |
| Mean | 4.8% | 2.5% |
| Median | 4.4% | 2.5% |
| Interquartile 25% (IQ1) | 3.3% | 1.4% |
| Interquartile 75% (IQ3) | 5.5% | 3.3% |
| Interquartile Range (IQR) | 2.2% | 1.9% |
| Standard Deviation (Sample) | 2.5% | 1.5% |
| Standard Deviation (Population) | 2.5% | 1.5% |
Similar Demographics by Professional Degree
Demographics Similar to Immigrants from South America by Professional Degree
In terms of professional degree, the demographic groups most similar to Immigrants from South America are Uruguayan (4.6%, a difference of 0.060%), Hungarian (4.6%, a difference of 0.070%), Sudanese (4.6%, a difference of 0.18%), Basque (4.6%, a difference of 0.31%), and Luxembourger (4.6%, a difference of 0.37%).
| Demographics | Rating | Rank | Professional Degree |
| Jordanians | 88.9 /100 | #137 | Excellent 4.7% |
| Afghans | 88.8 /100 | #138 | Excellent 4.7% |
| South Americans | 85.6 /100 | #139 | Excellent 4.7% |
| Canadians | 84.4 /100 | #140 | Excellent 4.7% |
| Basques | 81.8 /100 | #141 | Excellent 4.6% |
| Sudanese | 81.3 /100 | #142 | Excellent 4.6% |
| Hungarians | 80.8 /100 | #143 | Excellent 4.6% |
| Immigrants | South America | 80.5 /100 | #144 | Excellent 4.6% |
| Uruguayans | 80.2 /100 | #145 | Excellent 4.6% |
| Luxembourgers | 78.7 /100 | #146 | Good 4.6% |
| Colombians | 77.7 /100 | #147 | Good 4.6% |
| Slovenes | 76.1 /100 | #148 | Good 4.6% |
| Senegalese | 75.3 /100 | #149 | Good 4.6% |
| Immigrants | Oceania | 73.4 /100 | #150 | Good 4.6% |
| Poles | 72.6 /100 | #151 | Good 4.6% |
Demographics Similar to Africans by Professional Degree
In terms of professional degree, the demographic groups most similar to Africans are Indonesian (3.7%, a difference of 0.010%), Immigrants from Guyana (3.7%, a difference of 0.19%), U.S. Virgin Islander (3.7%, a difference of 0.20%), Immigrants from St. Vincent and the Grenadines (3.7%, a difference of 0.22%), and Bahamian (3.7%, a difference of 0.30%).
| Demographics | Rating | Rank | Professional Degree |
| Jamaicans | 1.4 /100 | #252 | Tragic 3.7% |
| Pueblo | 1.4 /100 | #253 | Tragic 3.7% |
| Tongans | 1.3 /100 | #254 | Tragic 3.7% |
| Osage | 1.2 /100 | #255 | Tragic 3.7% |
| Iroquois | 1.2 /100 | #256 | Tragic 3.7% |
| Bahamians | 1.1 /100 | #257 | Tragic 3.7% |
| Immigrants | St. Vincent and the Grenadines | 1.1 /100 | #258 | Tragic 3.7% |
| Africans | 1.0 /100 | #259 | Tragic 3.7% |
| Indonesians | 1.0 /100 | #260 | Tragic 3.7% |
| Immigrants | Guyana | 1.0 /100 | #261 | Tragic 3.7% |
| U.S. Virgin Islanders | 1.0 /100 | #262 | Tragic 3.7% |
| Hopi | 0.9 /100 | #263 | Tragic 3.6% |
| Immigrants | Cambodia | 0.9 /100 | #264 | Tragic 3.6% |
| Immigrants | Congo | 0.8 /100 | #265 | Tragic 3.6% |
| Central American Indians | 0.8 /100 | #266 | Tragic 3.6% |