Sri Lankan vs Soviet Union 9th Grade
COMPARE
Sri Lankan
Soviet Union
9th Grade
9th Grade Comparison
Sri Lankans
Soviet Union
93.2%
9TH GRADE
0.0/ 100
METRIC RATING
293rd/ 347
METRIC RANK
95.4%
9TH GRADE
95.6/ 100
METRIC RATING
119th/ 347
METRIC RANK
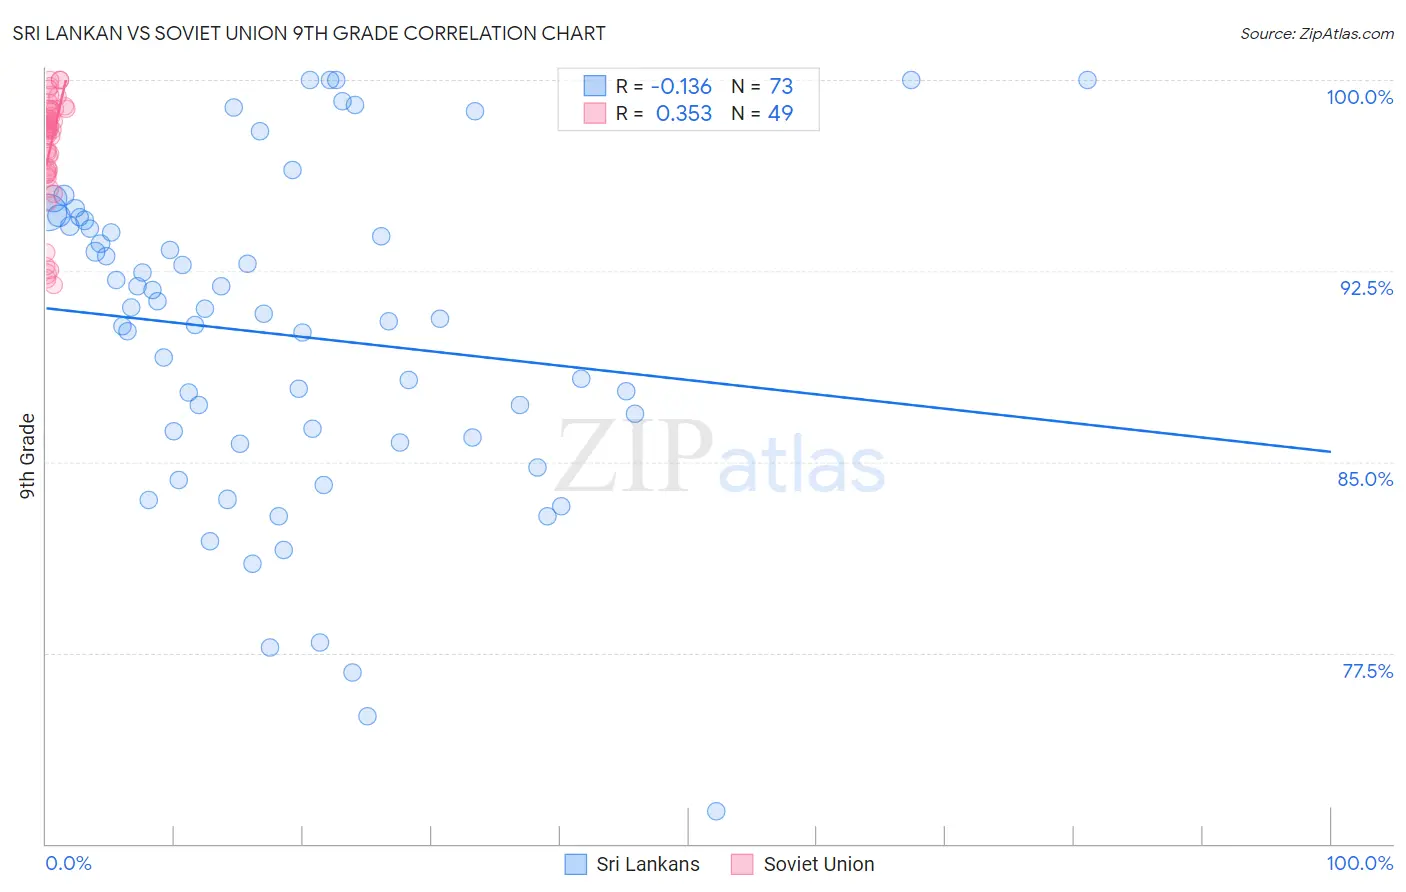
Sri Lankan vs Soviet Union 9th Grade Correlation Chart
The statistical analysis conducted on geographies consisting of 440,593,537 people shows a poor negative correlation between the proportion of Sri Lankans and percentage of population with at least 9th grade education in the United States with a correlation coefficient (R) of -0.136 and weighted average of 93.2%. Similarly, the statistical analysis conducted on geographies consisting of 43,454,395 people shows a mild positive correlation between the proportion of Soviet Union and percentage of population with at least 9th grade education in the United States with a correlation coefficient (R) of 0.353 and weighted average of 95.4%, a difference of 2.4%.
9th Grade Correlation Summary
| Measurement | Sri Lankan | Soviet Union |
| Minimum | 71.3% | 92.0% |
| Maximum | 100.0% | 100.0% |
| Range | 28.7% | 8.0% |
| Mean | 90.0% | 97.3% |
| Median | 90.8% | 98.1% |
| Interquartile 25% (IQ1) | 85.9% | 96.3% |
| Interquartile 75% (IQ3) | 94.4% | 98.9% |
| Interquartile Range (IQR) | 8.5% | 2.5% |
| Standard Deviation (Sample) | 6.4% | 2.2% |
| Standard Deviation (Population) | 6.4% | 2.2% |
Similar Demographics by 9th Grade
Demographics Similar to Sri Lankans by 9th Grade
In terms of 9th grade, the demographic groups most similar to Sri Lankans are Cuban (93.2%, a difference of 0.0%), Immigrants from Laos (93.2%, a difference of 0.010%), Immigrants from Burma/Myanmar (93.1%, a difference of 0.020%), British West Indian (93.2%, a difference of 0.030%), and Indonesian (93.1%, a difference of 0.030%).
| Demographics | Rating | Rank | 9th Grade |
| Immigrants | Barbados | 0.0 /100 | #286 | Tragic 93.4% |
| Immigrants | St. Vincent and the Grenadines | 0.0 /100 | #287 | Tragic 93.4% |
| Immigrants | South Eastern Asia | 0.0 /100 | #288 | Tragic 93.3% |
| Immigrants | West Indies | 0.0 /100 | #289 | Tragic 93.3% |
| Pennsylvania Germans | 0.0 /100 | #290 | Tragic 93.3% |
| British West Indians | 0.0 /100 | #291 | Tragic 93.2% |
| Immigrants | Laos | 0.0 /100 | #292 | Tragic 93.2% |
| Sri Lankans | 0.0 /100 | #293 | Tragic 93.2% |
| Cubans | 0.0 /100 | #294 | Tragic 93.2% |
| Immigrants | Burma/Myanmar | 0.0 /100 | #295 | Tragic 93.1% |
| Indonesians | 0.0 /100 | #296 | Tragic 93.1% |
| Fijians | 0.0 /100 | #297 | Tragic 93.1% |
| Haitians | 0.0 /100 | #298 | Tragic 93.1% |
| Immigrants | Grenada | 0.0 /100 | #299 | Tragic 93.0% |
| Yaqui | 0.0 /100 | #300 | Tragic 92.9% |
Demographics Similar to Soviet Union by 9th Grade
In terms of 9th grade, the demographic groups most similar to Soviet Union are Immigrants from Europe (95.4%, a difference of 0.0%), Immigrants from Romania (95.4%, a difference of 0.0%), Immigrants from Turkey (95.4%, a difference of 0.0%), Cambodian (95.4%, a difference of 0.0%), and Cree (95.4%, a difference of 0.0%).
| Demographics | Rating | Rank | 9th Grade |
| Immigrants | Croatia | 96.2 /100 | #112 | Exceptional 95.4% |
| Iroquois | 96.2 /100 | #113 | Exceptional 95.4% |
| German Russians | 96.1 /100 | #114 | Exceptional 95.4% |
| Burmese | 96.0 /100 | #115 | Exceptional 95.4% |
| Immigrants | Europe | 95.7 /100 | #116 | Exceptional 95.4% |
| Immigrants | Romania | 95.6 /100 | #117 | Exceptional 95.4% |
| Immigrants | Turkey | 95.6 /100 | #118 | Exceptional 95.4% |
| Soviet Union | 95.6 /100 | #119 | Exceptional 95.4% |
| Cambodians | 95.6 /100 | #120 | Exceptional 95.4% |
| Cree | 95.5 /100 | #121 | Exceptional 95.4% |
| Immigrants | Kuwait | 95.5 /100 | #122 | Exceptional 95.4% |
| Kiowa | 95.3 /100 | #123 | Exceptional 95.4% |
| Shoshone | 95.3 /100 | #124 | Exceptional 95.4% |
| Immigrants | South Central Asia | 95.1 /100 | #125 | Exceptional 95.4% |
| Immigrants | Serbia | 94.4 /100 | #126 | Exceptional 95.4% |