French vs Immigrants from Bolivia High School Diploma
COMPARE
French
Immigrants from Bolivia
High School Diploma
High School Diploma Comparison
French
Immigrants from Bolivia
91.0%
HIGH SCHOOL DIPLOMA
99.5/ 100
METRIC RATING
66th/ 347
METRIC RANK
88.4%
HIGH SCHOOL DIPLOMA
10.3/ 100
METRIC RATING
218th/ 347
METRIC RANK
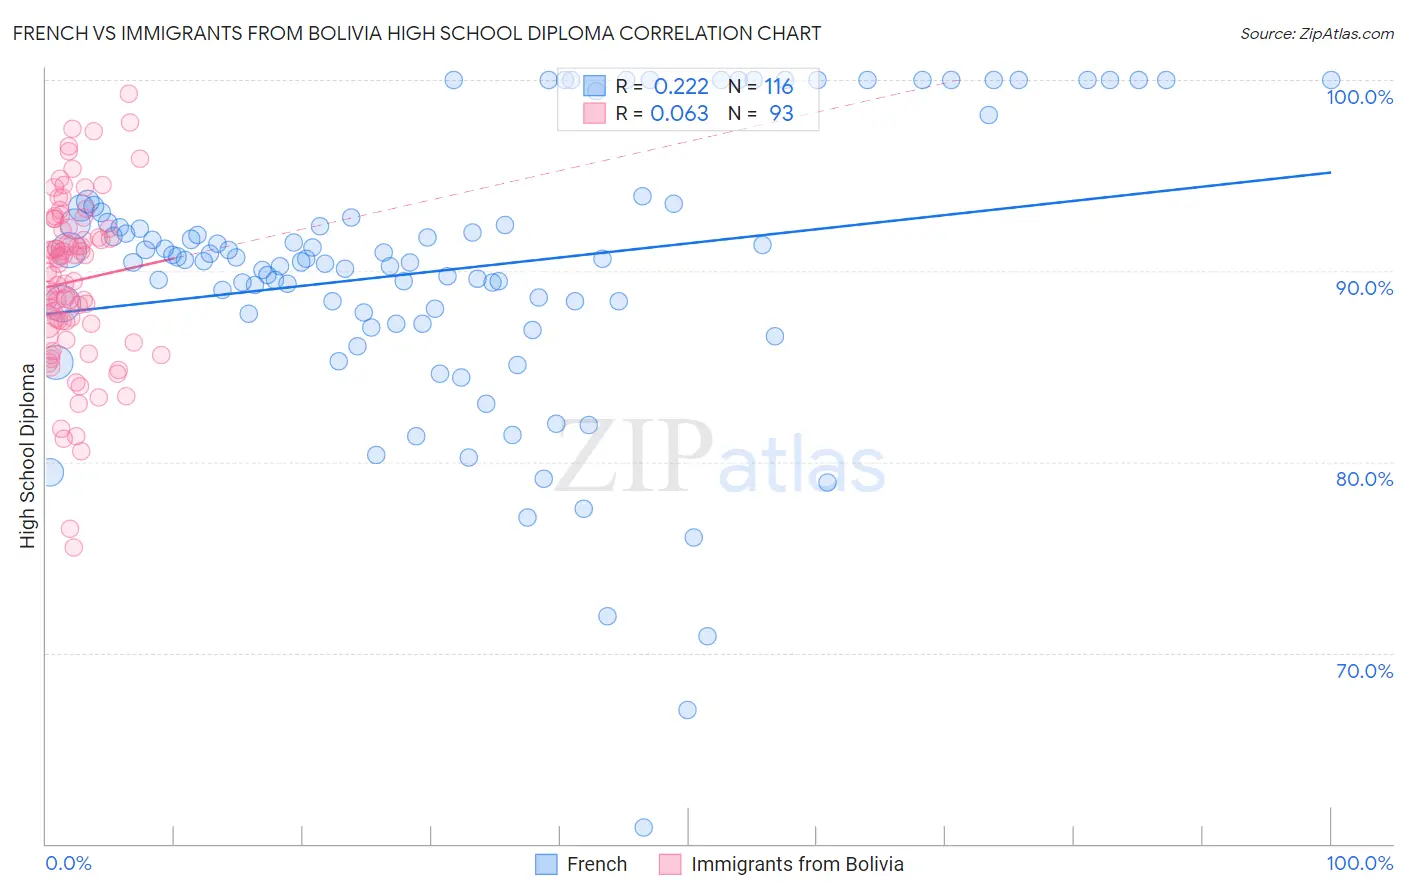
French vs Immigrants from Bolivia High School Diploma Correlation Chart
The statistical analysis conducted on geographies consisting of 572,427,361 people shows a weak positive correlation between the proportion of French and percentage of population with at least high school diploma education in the United States with a correlation coefficient (R) of 0.222 and weighted average of 91.0%. Similarly, the statistical analysis conducted on geographies consisting of 158,727,043 people shows a slight positive correlation between the proportion of Immigrants from Bolivia and percentage of population with at least high school diploma education in the United States with a correlation coefficient (R) of 0.063 and weighted average of 88.4%, a difference of 2.9%.
High School Diploma Correlation Summary
| Measurement | French | Immigrants from Bolivia |
| Minimum | 60.9% | 75.5% |
| Maximum | 100.0% | 99.3% |
| Range | 39.1% | 23.7% |
| Mean | 90.1% | 89.5% |
| Median | 90.6% | 89.9% |
| Interquartile 25% (IQ1) | 87.8% | 86.9% |
| Interquartile 75% (IQ3) | 92.9% | 92.3% |
| Interquartile Range (IQR) | 5.1% | 5.3% |
| Standard Deviation (Sample) | 7.3% | 4.5% |
| Standard Deviation (Population) | 7.2% | 4.4% |
Similar Demographics by High School Diploma
Demographics Similar to French by High School Diploma
In terms of high school diploma, the demographic groups most similar to French are Ukrainian (91.0%, a difference of 0.010%), Immigrants from South Africa (91.0%, a difference of 0.010%), Immigrants from Netherlands (91.0%, a difference of 0.020%), Immigrants from Iran (90.9%, a difference of 0.020%), and Czechoslovakian (90.9%, a difference of 0.030%).
| Demographics | Rating | Rank | High School Diploma |
| Immigrants | North America | 99.7 /100 | #59 | Exceptional 91.0% |
| Immigrants | Japan | 99.6 /100 | #60 | Exceptional 91.0% |
| Immigrants | Taiwan | 99.6 /100 | #61 | Exceptional 91.0% |
| Austrians | 99.6 /100 | #62 | Exceptional 91.0% |
| Immigrants | Netherlands | 99.6 /100 | #63 | Exceptional 91.0% |
| Ukrainians | 99.6 /100 | #64 | Exceptional 91.0% |
| Immigrants | South Africa | 99.6 /100 | #65 | Exceptional 91.0% |
| French | 99.5 /100 | #66 | Exceptional 91.0% |
| Immigrants | Iran | 99.5 /100 | #67 | Exceptional 90.9% |
| Czechoslovakians | 99.5 /100 | #68 | Exceptional 90.9% |
| French Canadians | 99.5 /100 | #69 | Exceptional 90.9% |
| Immigrants | Latvia | 99.5 /100 | #70 | Exceptional 90.9% |
| Alaskan Athabascans | 99.4 /100 | #71 | Exceptional 90.9% |
| Soviet Union | 99.4 /100 | #72 | Exceptional 90.9% |
| Immigrants | South Central Asia | 99.4 /100 | #73 | Exceptional 90.9% |
Demographics Similar to Immigrants from Bolivia by High School Diploma
In terms of high school diploma, the demographic groups most similar to Immigrants from Bolivia are Immigrants from Africa (88.4%, a difference of 0.010%), Crow (88.4%, a difference of 0.020%), Chickasaw (88.4%, a difference of 0.020%), Immigrants from Cameroon (88.4%, a difference of 0.030%), and Costa Rican (88.4%, a difference of 0.030%).
| Demographics | Rating | Rank | High School Diploma |
| Inupiat | 13.1 /100 | #211 | Poor 88.5% |
| South American Indians | 12.2 /100 | #212 | Poor 88.5% |
| Immigrants | Somalia | 11.3 /100 | #213 | Poor 88.4% |
| Immigrants | Cameroon | 10.9 /100 | #214 | Poor 88.4% |
| Crow | 10.9 /100 | #215 | Poor 88.4% |
| Chickasaw | 10.7 /100 | #216 | Poor 88.4% |
| Immigrants | Africa | 10.6 /100 | #217 | Poor 88.4% |
| Immigrants | Bolivia | 10.3 /100 | #218 | Poor 88.4% |
| Costa Ricans | 9.6 /100 | #219 | Tragic 88.4% |
| Tongans | 9.5 /100 | #220 | Tragic 88.4% |
| Immigrants | Afghanistan | 8.6 /100 | #221 | Tragic 88.3% |
| Colville | 7.8 /100 | #222 | Tragic 88.3% |
| Immigrants | Zaire | 7.6 /100 | #223 | Tragic 88.3% |
| Shoshone | 7.0 /100 | #224 | Tragic 88.3% |
| Creek | 6.9 /100 | #225 | Tragic 88.3% |