German vs Vietnamese Doctorate Degree
COMPARE
German
Vietnamese
Doctorate Degree
Doctorate Degree Comparison
Germans
Vietnamese
1.8%
DOCTORATE DEGREE
30.5/ 100
METRIC RATING
188th/ 347
METRIC RANK
1.9%
DOCTORATE DEGREE
54.8/ 100
METRIC RATING
169th/ 347
METRIC RANK
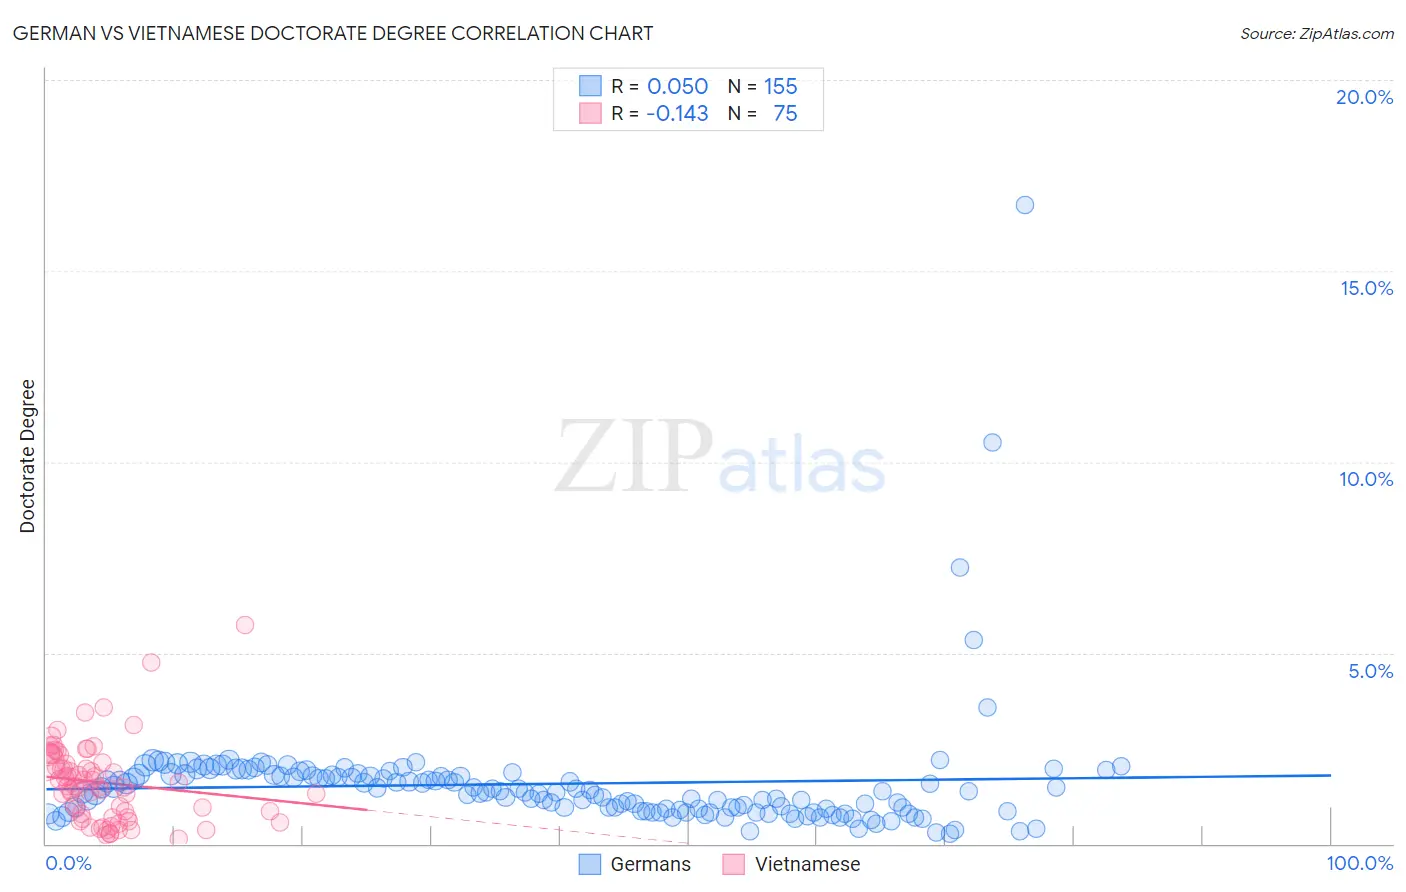
German vs Vietnamese Doctorate Degree Correlation Chart
The statistical analysis conducted on geographies consisting of 551,426,509 people shows no correlation between the proportion of Germans and percentage of population with at least doctorate degree education in the United States with a correlation coefficient (R) of 0.050 and weighted average of 1.8%. Similarly, the statistical analysis conducted on geographies consisting of 170,365,773 people shows a poor negative correlation between the proportion of Vietnamese and percentage of population with at least doctorate degree education in the United States with a correlation coefficient (R) of -0.143 and weighted average of 1.9%, a difference of 3.8%.
Doctorate Degree Correlation Summary
| Measurement | German | Vietnamese |
| Minimum | 0.25% | 0.14% |
| Maximum | 16.7% | 5.7% |
| Range | 16.5% | 5.6% |
| Mean | 1.6% | 1.6% |
| Median | 1.4% | 1.5% |
| Interquartile 25% (IQ1) | 0.89% | 0.69% |
| Interquartile 75% (IQ3) | 1.8% | 2.1% |
| Interquartile Range (IQR) | 0.92% | 1.4% |
| Standard Deviation (Sample) | 1.6% | 1.0% |
| Standard Deviation (Population) | 1.6% | 1.0% |
Demographics Similar to Germans and Vietnamese by Doctorate Degree
In terms of doctorate degree, the demographic groups most similar to Germans are Czechoslovakian (1.8%, a difference of 0.45%), Peruvian (1.8%, a difference of 0.68%), Slovak (1.8%, a difference of 1.0%), Nigerian (1.8%, a difference of 1.6%), and Finnish (1.8%, a difference of 1.9%). Similarly, the demographic groups most similar to Vietnamese are Costa Rican (1.8%, a difference of 0.22%), Bermudan (1.8%, a difference of 0.39%), Belgian (1.8%, a difference of 0.66%), Norwegian (1.8%, a difference of 0.70%), and Immigrants from Bangladesh (1.8%, a difference of 0.70%).
| Demographics | Rating | Rank | Doctorate Degree |
| Sri Lankans | 60.3 /100 | #168 | Good 1.9% |
| Vietnamese | 54.8 /100 | #169 | Average 1.9% |
| Costa Ricans | 53.3 /100 | #170 | Average 1.8% |
| Bermudans | 52.1 /100 | #171 | Average 1.8% |
| Belgians | 50.3 /100 | #172 | Average 1.8% |
| Norwegians | 50.0 /100 | #173 | Average 1.8% |
| Immigrants | Bangladesh | 50.0 /100 | #174 | Average 1.8% |
| Immigrants | Thailand | 49.4 /100 | #175 | Average 1.8% |
| Spanish | 49.3 /100 | #176 | Average 1.8% |
| Iraqis | 49.2 /100 | #177 | Average 1.8% |
| French | 48.8 /100 | #178 | Average 1.8% |
| Ghanaians | 48.3 /100 | #179 | Average 1.8% |
| Scandinavians | 48.0 /100 | #180 | Average 1.8% |
| Immigrants | Immigrants | 46.2 /100 | #181 | Average 1.8% |
| Immigrants | Afghanistan | 44.3 /100 | #182 | Average 1.8% |
| Finns | 42.1 /100 | #183 | Average 1.8% |
| Nigerians | 39.9 /100 | #184 | Fair 1.8% |
| Slovaks | 36.4 /100 | #185 | Fair 1.8% |
| Peruvians | 34.4 /100 | #186 | Fair 1.8% |
| Czechoslovakians | 33.0 /100 | #187 | Fair 1.8% |
| Germans | 30.5 /100 | #188 | Fair 1.8% |