German vs Immigrants from Cabo Verde No Schooling Completed
COMPARE
German
Immigrants from Cabo Verde
No Schooling Completed
No Schooling Completed Comparison
Germans
Immigrants from Cabo Verde
1.4%
NO SCHOOLING COMPLETED
100.0/ 100
METRIC RATING
4th/ 347
METRIC RANK
3.5%
NO SCHOOLING COMPLETED
0.0/ 100
METRIC RATING
337th/ 347
METRIC RANK
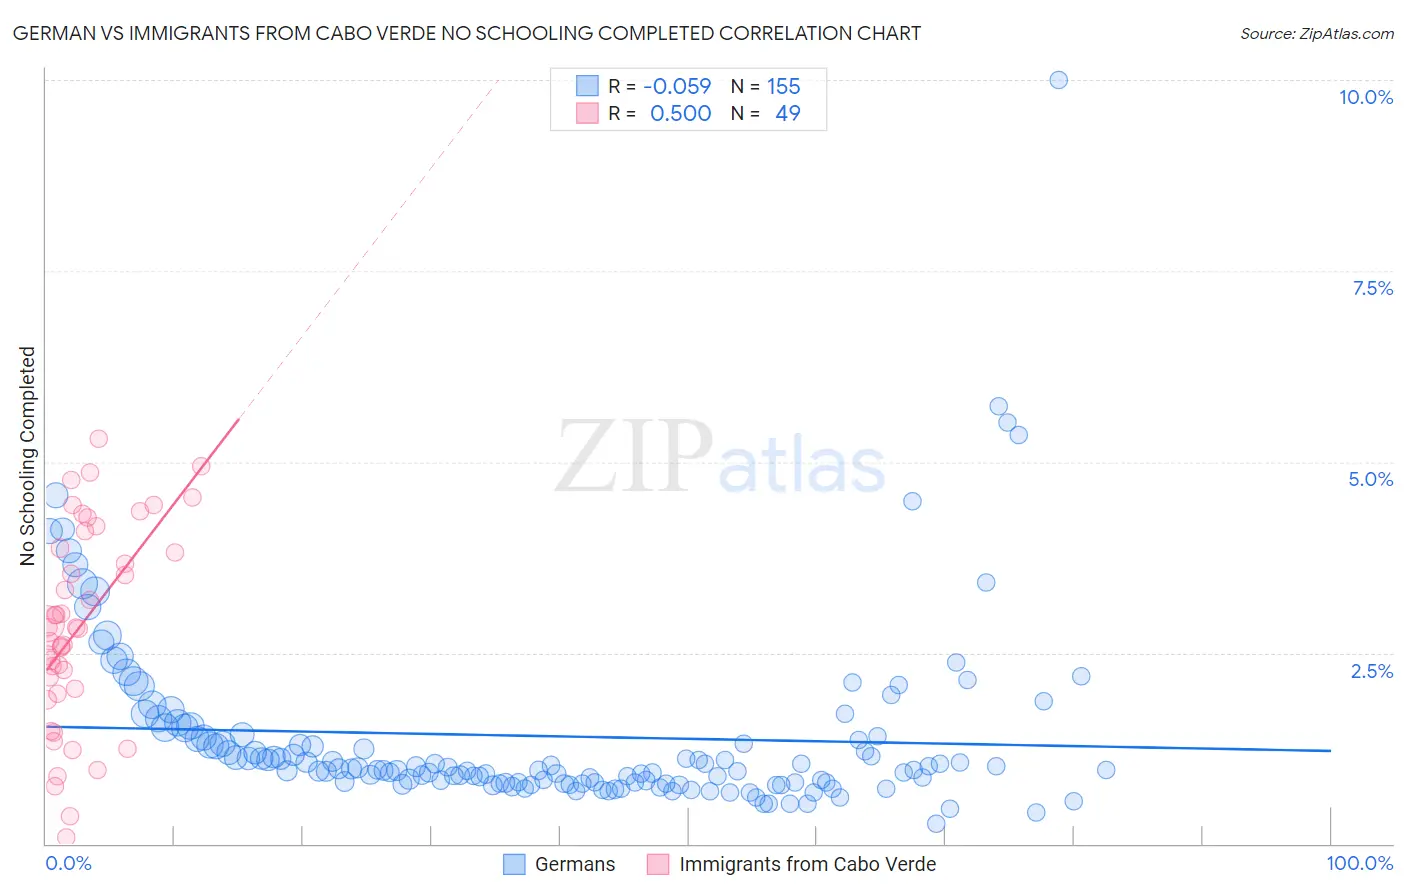
German vs Immigrants from Cabo Verde No Schooling Completed Correlation Chart
The statistical analysis conducted on geographies consisting of 559,407,426 people shows a slight negative correlation between the proportion of Germans and percentage of population with no schooling in the United States with a correlation coefficient (R) of -0.059 and weighted average of 1.4%. Similarly, the statistical analysis conducted on geographies consisting of 38,057,736 people shows a substantial positive correlation between the proportion of Immigrants from Cabo Verde and percentage of population with no schooling in the United States with a correlation coefficient (R) of 0.500 and weighted average of 3.5%, a difference of 160.6%.
No Schooling Completed Correlation Summary
| Measurement | German | Immigrants from Cabo Verde |
| Minimum | 0.26% | 0.088% |
| Maximum | 10.0% | 5.3% |
| Range | 9.7% | 5.2% |
| Mean | 1.4% | 2.9% |
| Median | 0.98% | 2.8% |
| Interquartile 25% (IQ1) | 0.80% | 2.0% |
| Interquartile 75% (IQ3) | 1.4% | 4.0% |
| Interquartile Range (IQR) | 0.61% | 2.0% |
| Standard Deviation (Sample) | 1.2% | 1.3% |
| Standard Deviation (Population) | 1.2% | 1.3% |
Similar Demographics by No Schooling Completed
Demographics Similar to Germans by No Schooling Completed
In terms of no schooling completed, the demographic groups most similar to Germans are Slovene (1.4%, a difference of 0.42%), Norwegian (1.3%, a difference of 0.56%), Slovak (1.3%, a difference of 0.99%), Carpatho Rusyn (1.4%, a difference of 1.2%), and English (1.4%, a difference of 2.2%).
| Demographics | Rating | Rank | No Schooling Completed |
| Yup'ik | 100.0 /100 | #1 | Exceptional 1.2% |
| Slovaks | 100.0 /100 | #2 | Exceptional 1.3% |
| Norwegians | 100.0 /100 | #3 | Exceptional 1.3% |
| Germans | 100.0 /100 | #4 | Exceptional 1.4% |
| Slovenes | 100.0 /100 | #5 | Exceptional 1.4% |
| Carpatho Rusyns | 100.0 /100 | #6 | Exceptional 1.4% |
| English | 100.0 /100 | #7 | Exceptional 1.4% |
| Swedes | 100.0 /100 | #8 | Exceptional 1.4% |
| Scottish | 100.0 /100 | #9 | Exceptional 1.4% |
| Dutch | 100.0 /100 | #10 | Exceptional 1.4% |
| Lithuanians | 100.0 /100 | #11 | Exceptional 1.4% |
| Irish | 100.0 /100 | #12 | Exceptional 1.4% |
| Poles | 100.0 /100 | #13 | Exceptional 1.4% |
| Scotch-Irish | 100.0 /100 | #14 | Exceptional 1.5% |
| Tlingit-Haida | 100.0 /100 | #15 | Exceptional 1.5% |
Demographics Similar to Immigrants from Cabo Verde by No Schooling Completed
In terms of no schooling completed, the demographic groups most similar to Immigrants from Cabo Verde are Bangladeshi (3.5%, a difference of 0.23%), Yakama (3.6%, a difference of 0.55%), Immigrants from Fiji (3.5%, a difference of 0.71%), Immigrants from Cambodia (3.5%, a difference of 1.1%), and Immigrants from Guatemala (3.6%, a difference of 1.2%).
| Demographics | Rating | Rank | No Schooling Completed |
| Immigrants | Armenia | 0.0 /100 | #330 | Tragic 3.3% |
| Japanese | 0.0 /100 | #331 | Tragic 3.3% |
| Central Americans | 0.0 /100 | #332 | Tragic 3.4% |
| Immigrants | Dominican Republic | 0.0 /100 | #333 | Tragic 3.4% |
| Guatemalans | 0.0 /100 | #334 | Tragic 3.5% |
| Immigrants | Cambodia | 0.0 /100 | #335 | Tragic 3.5% |
| Immigrants | Fiji | 0.0 /100 | #336 | Tragic 3.5% |
| Immigrants | Cabo Verde | 0.0 /100 | #337 | Tragic 3.5% |
| Bangladeshis | 0.0 /100 | #338 | Tragic 3.5% |
| Yakama | 0.0 /100 | #339 | Tragic 3.6% |
| Immigrants | Guatemala | 0.0 /100 | #340 | Tragic 3.6% |
| Immigrants | Central America | 0.0 /100 | #341 | Tragic 3.6% |
| Immigrants | Mexico | 0.0 /100 | #342 | Tragic 3.6% |
| Salvadorans | 0.0 /100 | #343 | Tragic 3.7% |
| Nepalese | 0.0 /100 | #344 | Tragic 3.8% |