Immigrants from Eastern Asia vs Ugandan College, Under 1 year
COMPARE
Immigrants from Eastern Asia
Ugandan
College, Under 1 year
College, Under 1 year Comparison
Immigrants from Eastern Asia
Ugandans
71.3%
COLLEGE, UNDER 1 YEAR
100.0/ 100
METRIC RATING
22nd/ 347
METRIC RANK
66.8%
COLLEGE, UNDER 1 YEAR
87.8/ 100
METRIC RATING
136th/ 347
METRIC RANK
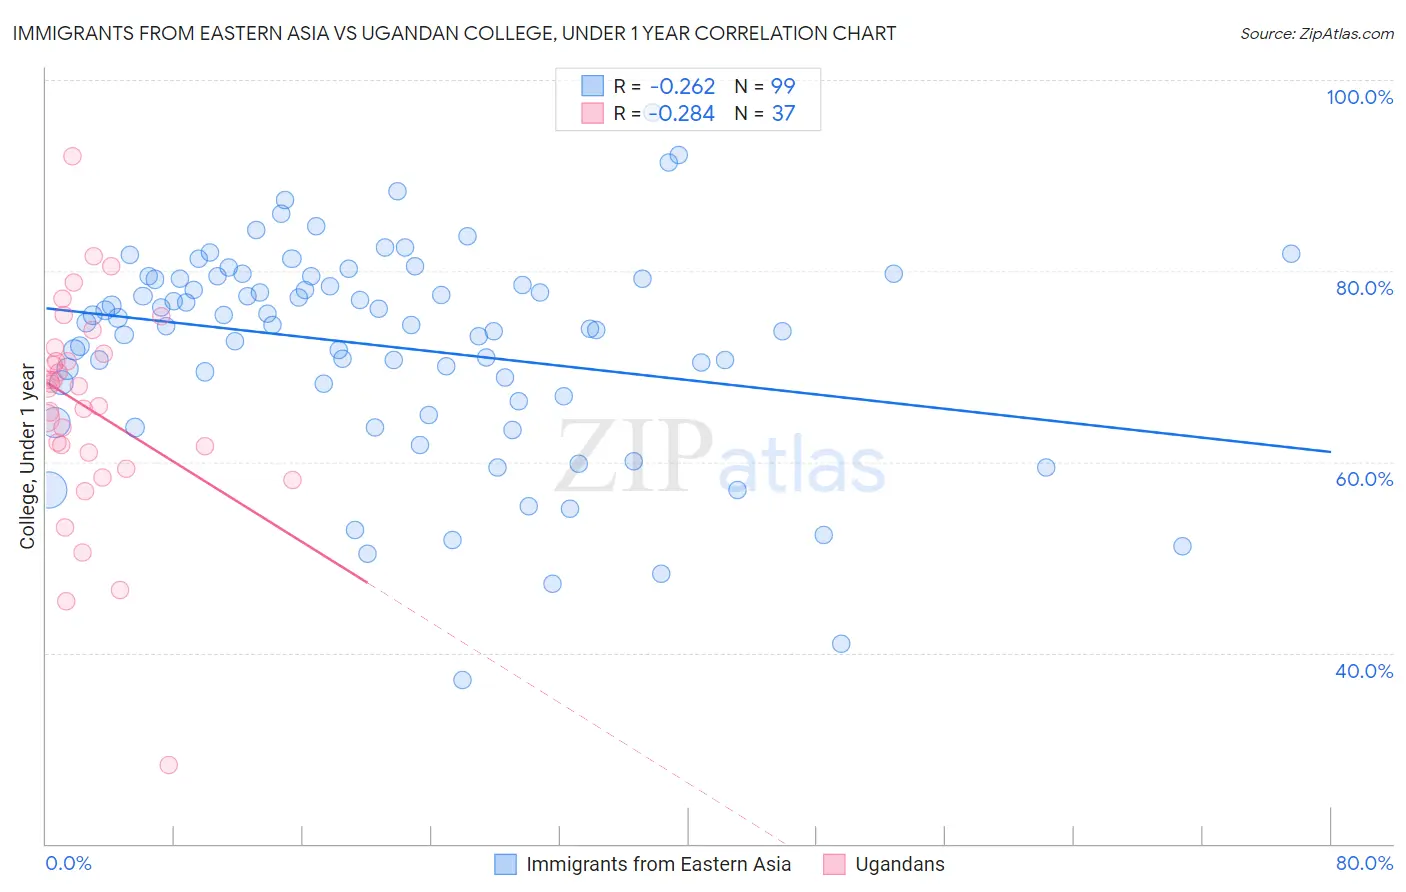
Immigrants from Eastern Asia vs Ugandan College, Under 1 year Correlation Chart
The statistical analysis conducted on geographies consisting of 499,935,420 people shows a weak negative correlation between the proportion of Immigrants from Eastern Asia and percentage of population with at least college, under 1 year education in the United States with a correlation coefficient (R) of -0.262 and weighted average of 71.3%. Similarly, the statistical analysis conducted on geographies consisting of 94,018,576 people shows a weak negative correlation between the proportion of Ugandans and percentage of population with at least college, under 1 year education in the United States with a correlation coefficient (R) of -0.284 and weighted average of 66.8%, a difference of 6.6%.
College, Under 1 year Correlation Summary
| Measurement | Immigrants from Eastern Asia | Ugandan |
| Minimum | 37.2% | 28.3% |
| Maximum | 96.6% | 92.0% |
| Range | 59.5% | 63.7% |
| Mean | 72.1% | 65.6% |
| Median | 74.4% | 67.7% |
| Interquartile 25% (IQ1) | 66.9% | 60.1% |
| Interquartile 75% (IQ3) | 79.2% | 71.7% |
| Interquartile Range (IQR) | 12.4% | 11.5% |
| Standard Deviation (Sample) | 11.1% | 11.5% |
| Standard Deviation (Population) | 11.0% | 11.3% |
Similar Demographics by College, Under 1 year
Demographics Similar to Immigrants from Eastern Asia by College, Under 1 year
In terms of college, under 1 year, the demographic groups most similar to Immigrants from Eastern Asia are Immigrants from Northern Europe (71.1%, a difference of 0.23%), Soviet Union (71.1%, a difference of 0.24%), Immigrants from Belgium (71.5%, a difference of 0.25%), Bulgarian (71.1%, a difference of 0.25%), and Immigrants from Denmark (71.0%, a difference of 0.37%).
| Demographics | Rating | Rank | College, Under 1 year |
| Burmese | 100.0 /100 | #15 | Exceptional 71.9% |
| Immigrants | Japan | 100.0 /100 | #16 | Exceptional 71.9% |
| Eastern Europeans | 100.0 /100 | #17 | Exceptional 71.8% |
| Immigrants | Switzerland | 100.0 /100 | #18 | Exceptional 71.7% |
| Latvians | 100.0 /100 | #19 | Exceptional 71.6% |
| Immigrants | Korea | 100.0 /100 | #20 | Exceptional 71.6% |
| Immigrants | Belgium | 100.0 /100 | #21 | Exceptional 71.5% |
| Immigrants | Eastern Asia | 100.0 /100 | #22 | Exceptional 71.3% |
| Immigrants | Northern Europe | 100.0 /100 | #23 | Exceptional 71.1% |
| Soviet Union | 100.0 /100 | #24 | Exceptional 71.1% |
| Bulgarians | 100.0 /100 | #25 | Exceptional 71.1% |
| Immigrants | Denmark | 100.0 /100 | #26 | Exceptional 71.0% |
| Immigrants | Ireland | 100.0 /100 | #27 | Exceptional 71.0% |
| Immigrants | Hong Kong | 100.0 /100 | #28 | Exceptional 71.0% |
| Immigrants | France | 100.0 /100 | #29 | Exceptional 71.0% |
Demographics Similar to Ugandans by College, Under 1 year
In terms of college, under 1 year, the demographic groups most similar to Ugandans are Canadian (66.8%, a difference of 0.010%), Iraqi (66.8%, a difference of 0.020%), Immigrants from Chile (66.8%, a difference of 0.040%), Immigrants from Brazil (66.9%, a difference of 0.050%), and Polish (66.9%, a difference of 0.070%).
| Demographics | Rating | Rank | College, Under 1 year |
| Immigrants | Eastern Africa | 89.5 /100 | #129 | Excellent 67.0% |
| Immigrants | Syria | 89.0 /100 | #130 | Excellent 66.9% |
| Finns | 88.6 /100 | #131 | Excellent 66.9% |
| Poles | 88.4 /100 | #132 | Excellent 66.9% |
| Immigrants | Brazil | 88.3 /100 | #133 | Excellent 66.9% |
| Iraqis | 88.0 /100 | #134 | Excellent 66.8% |
| Canadians | 87.9 /100 | #135 | Excellent 66.8% |
| Ugandans | 87.8 /100 | #136 | Excellent 66.8% |
| Immigrants | Chile | 87.4 /100 | #137 | Excellent 66.8% |
| Immigrants | Italy | 86.9 /100 | #138 | Excellent 66.8% |
| Venezuelans | 85.9 /100 | #139 | Excellent 66.7% |
| Slavs | 85.9 /100 | #140 | Excellent 66.7% |
| Immigrants | Afghanistan | 85.1 /100 | #141 | Excellent 66.7% |
| English | 82.9 /100 | #142 | Excellent 66.6% |
| Immigrants | Uganda | 82.8 /100 | #143 | Excellent 66.5% |