German Russian vs Immigrants from Japan Associate's Degree
COMPARE
German Russian
Immigrants from Japan
Associate's Degree
Associate's Degree Comparison
German Russians
Immigrants from Japan
45.1%
ASSOCIATE'S DEGREE
18.9/ 100
METRIC RATING
206th/ 347
METRIC RANK
54.6%
ASSOCIATE'S DEGREE
100.0/ 100
METRIC RATING
22nd/ 347
METRIC RANK
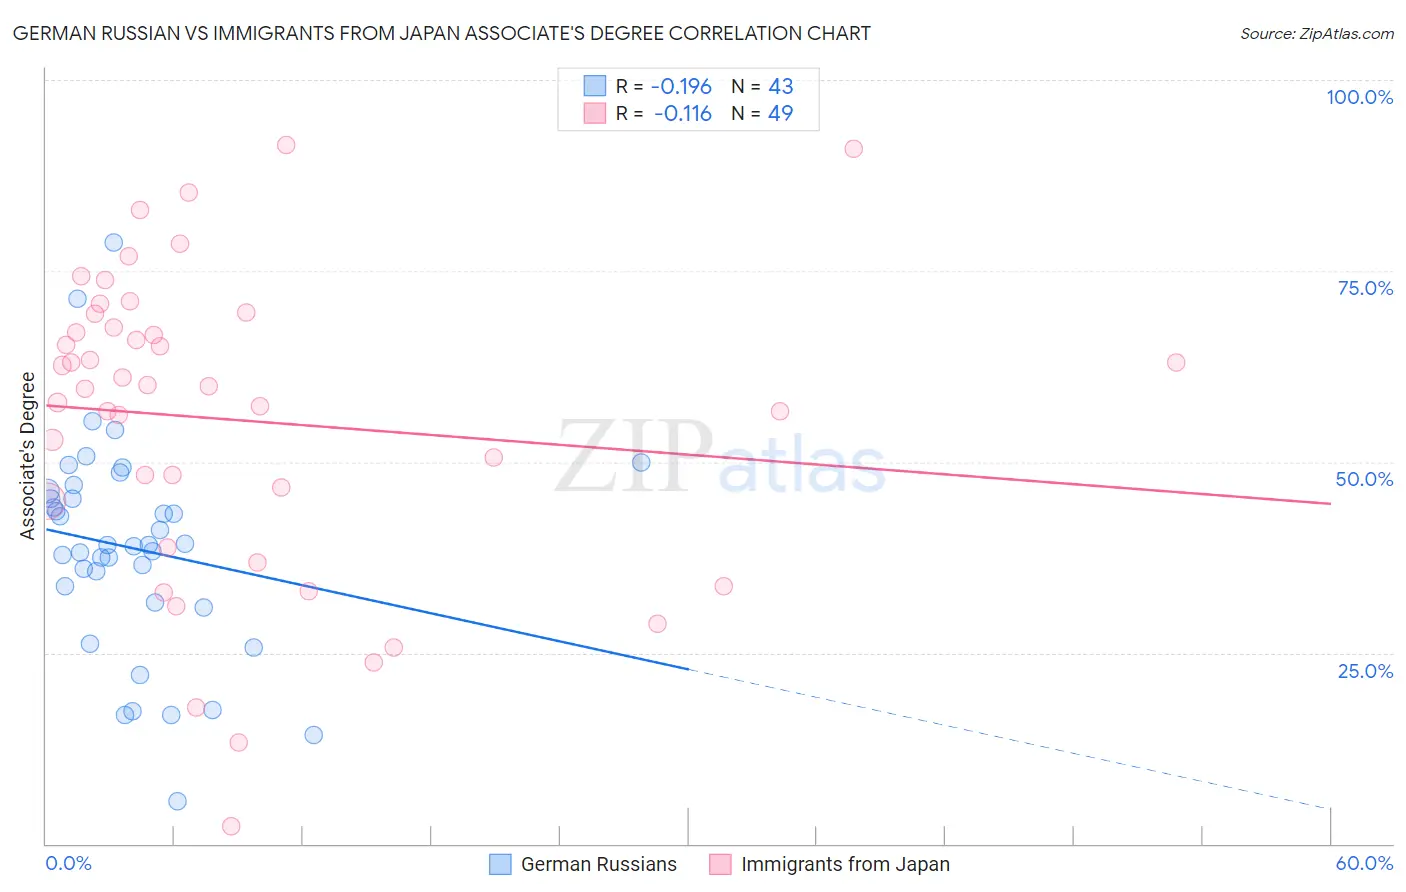
German Russian vs Immigrants from Japan Associate's Degree Correlation Chart
The statistical analysis conducted on geographies consisting of 96,460,905 people shows a poor negative correlation between the proportion of German Russians and percentage of population with at least associate's degree education in the United States with a correlation coefficient (R) of -0.196 and weighted average of 45.1%. Similarly, the statistical analysis conducted on geographies consisting of 340,131,347 people shows a poor negative correlation between the proportion of Immigrants from Japan and percentage of population with at least associate's degree education in the United States with a correlation coefficient (R) of -0.116 and weighted average of 54.6%, a difference of 21.1%.
Associate's Degree Correlation Summary
| Measurement | German Russian | Immigrants from Japan |
| Minimum | 5.6% | 2.2% |
| Maximum | 78.7% | 91.6% |
| Range | 73.1% | 89.3% |
| Mean | 38.6% | 55.5% |
| Median | 39.1% | 60.0% |
| Interquartile 25% (IQ1) | 31.5% | 41.7% |
| Interquartile 75% (IQ3) | 46.2% | 68.5% |
| Interquartile Range (IQR) | 14.6% | 26.8% |
| Standard Deviation (Sample) | 14.2% | 20.1% |
| Standard Deviation (Population) | 14.0% | 19.9% |
Similar Demographics by Associate's Degree
Demographics Similar to German Russians by Associate's Degree
In terms of associate's degree, the demographic groups most similar to German Russians are Immigrants from Thailand (45.1%, a difference of 0.0%), Nigerian (45.1%, a difference of 0.030%), Panamanian (45.1%, a difference of 0.070%), Immigrants from South Eastern Asia (45.2%, a difference of 0.17%), and Dutch (45.0%, a difference of 0.17%).
| Demographics | Rating | Rank | Associate's Degree |
| Immigrants | Senegal | 21.2 /100 | #199 | Fair 45.2% |
| Senegalese | 21.1 /100 | #200 | Fair 45.2% |
| Immigrants | Vietnam | 20.8 /100 | #201 | Fair 45.2% |
| Spaniards | 20.4 /100 | #202 | Fair 45.2% |
| Immigrants | South Eastern Asia | 20.2 /100 | #203 | Fair 45.2% |
| Nigerians | 19.1 /100 | #204 | Poor 45.1% |
| Immigrants | Thailand | 18.9 /100 | #205 | Poor 45.1% |
| German Russians | 18.9 /100 | #206 | Poor 45.1% |
| Panamanians | 18.4 /100 | #207 | Poor 45.1% |
| Dutch | 17.6 /100 | #208 | Poor 45.0% |
| Immigrants | Costa Rica | 16.7 /100 | #209 | Poor 45.0% |
| Immigrants | Philippines | 16.7 /100 | #210 | Poor 45.0% |
| Immigrants | Zaire | 16.6 /100 | #211 | Poor 45.0% |
| French Canadians | 15.0 /100 | #212 | Poor 44.9% |
| Immigrants | Ghana | 14.2 /100 | #213 | Poor 44.8% |
Demographics Similar to Immigrants from Japan by Associate's Degree
In terms of associate's degree, the demographic groups most similar to Immigrants from Japan are Burmese (54.6%, a difference of 0.0%), Immigrants from Sweden (54.6%, a difference of 0.030%), Immigrants from Korea (54.5%, a difference of 0.090%), Cambodian (54.6%, a difference of 0.10%), and Immigrants from Ireland (54.7%, a difference of 0.12%).
| Demographics | Rating | Rank | Associate's Degree |
| Immigrants | Eastern Asia | 100.0 /100 | #15 | Exceptional 55.4% |
| Soviet Union | 100.0 /100 | #16 | Exceptional 55.1% |
| Eastern Europeans | 100.0 /100 | #17 | Exceptional 55.0% |
| Indians (Asian) | 100.0 /100 | #18 | Exceptional 54.8% |
| Immigrants | Ireland | 100.0 /100 | #19 | Exceptional 54.7% |
| Cambodians | 100.0 /100 | #20 | Exceptional 54.6% |
| Immigrants | Sweden | 100.0 /100 | #21 | Exceptional 54.6% |
| Immigrants | Japan | 100.0 /100 | #22 | Exceptional 54.6% |
| Burmese | 100.0 /100 | #23 | Exceptional 54.6% |
| Immigrants | Korea | 100.0 /100 | #24 | Exceptional 54.5% |
| Immigrants | Switzerland | 100.0 /100 | #25 | Exceptional 54.5% |
| Immigrants | Belgium | 100.0 /100 | #26 | Exceptional 54.5% |
| Latvians | 100.0 /100 | #27 | Exceptional 53.9% |
| Turks | 100.0 /100 | #28 | Exceptional 53.9% |
| Immigrants | France | 100.0 /100 | #29 | Exceptional 53.9% |