French Canadian vs Lebanese No Schooling Completed
COMPARE
French Canadian
Lebanese
No Schooling Completed
No Schooling Completed Comparison
French Canadians
Lebanese
1.5%
NO SCHOOLING COMPLETED
100.0/ 100
METRIC RATING
28th/ 347
METRIC RANK
1.9%
NO SCHOOLING COMPLETED
96.0/ 100
METRIC RATING
116th/ 347
METRIC RANK
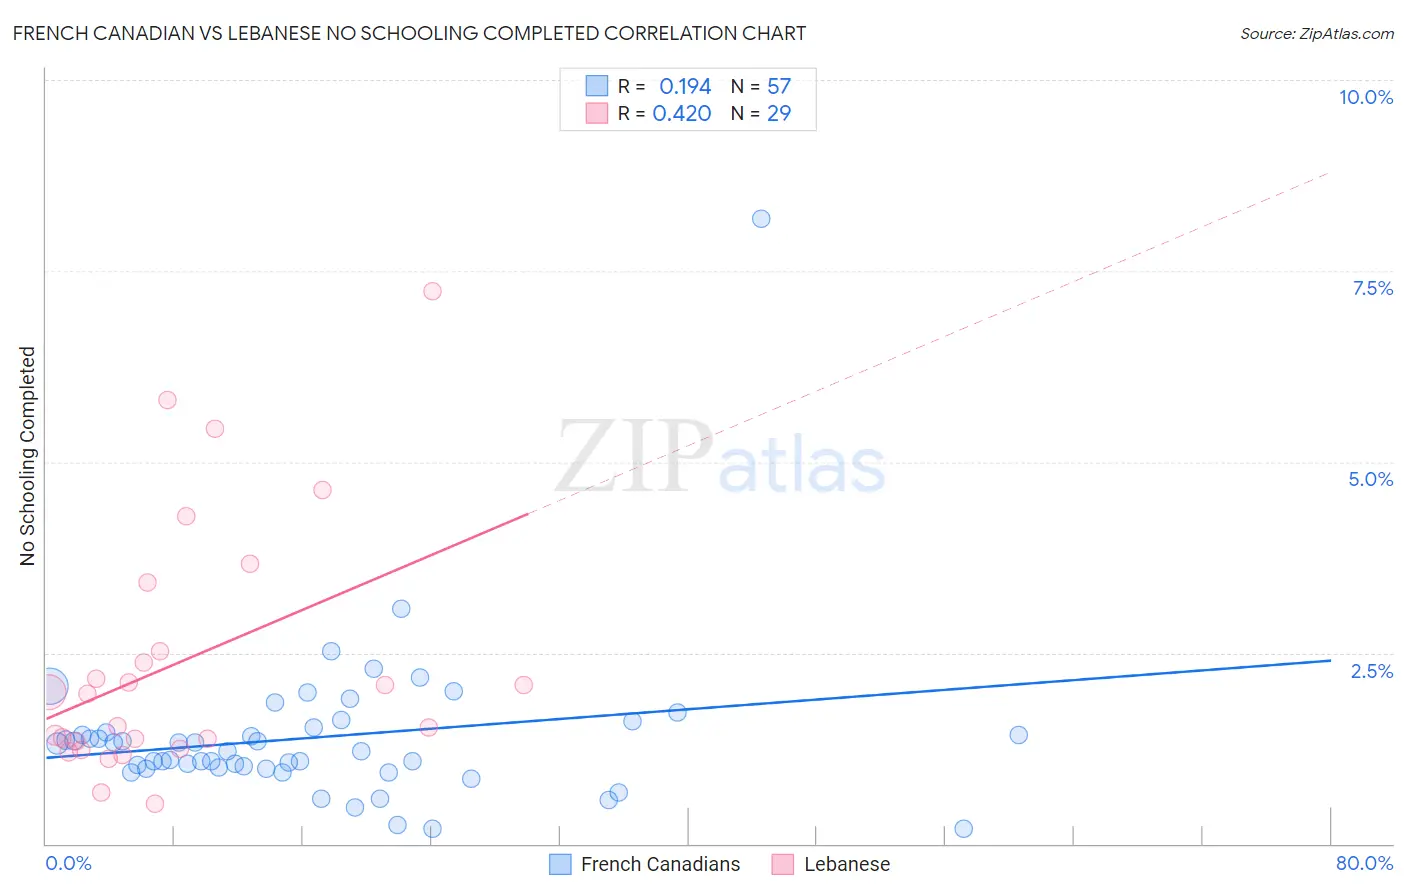
French Canadian vs Lebanese No Schooling Completed Correlation Chart
The statistical analysis conducted on geographies consisting of 491,496,199 people shows a poor positive correlation between the proportion of French Canadians and percentage of population with no schooling in the United States with a correlation coefficient (R) of 0.194 and weighted average of 1.5%. Similarly, the statistical analysis conducted on geographies consisting of 396,753,431 people shows a moderate positive correlation between the proportion of Lebanese and percentage of population with no schooling in the United States with a correlation coefficient (R) of 0.420 and weighted average of 1.9%, a difference of 24.5%.
No Schooling Completed Correlation Summary
| Measurement | French Canadian | Lebanese |
| Minimum | 0.20% | 0.52% |
| Maximum | 8.2% | 7.2% |
| Range | 8.0% | 6.7% |
| Mean | 1.4% | 2.4% |
| Median | 1.2% | 2.0% |
| Interquartile 25% (IQ1) | 0.99% | 1.3% |
| Interquartile 75% (IQ3) | 1.5% | 3.0% |
| Interquartile Range (IQR) | 0.49% | 1.7% |
| Standard Deviation (Sample) | 1.1% | 1.7% |
| Standard Deviation (Population) | 1.1% | 1.6% |
Similar Demographics by No Schooling Completed
Demographics Similar to French Canadians by No Schooling Completed
In terms of no schooling completed, the demographic groups most similar to French Canadians are Scandinavian (1.5%, a difference of 0.010%), Czech (1.5%, a difference of 0.54%), Lumbee (1.5%, a difference of 0.91%), French (1.5%, a difference of 1.1%), and Pennsylvania German (1.5%, a difference of 1.1%).
| Demographics | Rating | Rank | No Schooling Completed |
| Chinese | 100.0 /100 | #21 | Exceptional 1.5% |
| Alaska Natives | 100.0 /100 | #22 | Exceptional 1.5% |
| Europeans | 100.0 /100 | #23 | Exceptional 1.5% |
| Pennsylvania Germans | 100.0 /100 | #24 | Exceptional 1.5% |
| French | 100.0 /100 | #25 | Exceptional 1.5% |
| Czechs | 100.0 /100 | #26 | Exceptional 1.5% |
| Scandinavians | 100.0 /100 | #27 | Exceptional 1.5% |
| French Canadians | 100.0 /100 | #28 | Exceptional 1.5% |
| Lumbee | 100.0 /100 | #29 | Exceptional 1.5% |
| British | 100.0 /100 | #30 | Exceptional 1.5% |
| Inupiat | 100.0 /100 | #31 | Exceptional 1.5% |
| Swiss | 100.0 /100 | #32 | Exceptional 1.5% |
| Italians | 100.0 /100 | #33 | Exceptional 1.5% |
| Latvians | 100.0 /100 | #34 | Exceptional 1.5% |
| Eastern Europeans | 100.0 /100 | #35 | Exceptional 1.6% |
Demographics Similar to Lebanese by No Schooling Completed
In terms of no schooling completed, the demographic groups most similar to Lebanese are Syrian (1.9%, a difference of 0.020%), Immigrants from Norway (1.9%, a difference of 0.15%), Immigrants from Zimbabwe (1.9%, a difference of 0.16%), Immigrants from Serbia (1.9%, a difference of 0.20%), and Pueblo (1.9%, a difference of 0.41%).
| Demographics | Rating | Rank | No Schooling Completed |
| Immigrants | Saudi Arabia | 96.8 /100 | #109 | Exceptional 1.9% |
| Immigrants | Latvia | 96.7 /100 | #110 | Exceptional 1.9% |
| Immigrants | Japan | 96.6 /100 | #111 | Exceptional 1.9% |
| Pueblo | 96.4 /100 | #112 | Exceptional 1.9% |
| Immigrants | Zimbabwe | 96.2 /100 | #113 | Exceptional 1.9% |
| Immigrants | Norway | 96.1 /100 | #114 | Exceptional 1.9% |
| Syrians | 96.0 /100 | #115 | Exceptional 1.9% |
| Lebanese | 96.0 /100 | #116 | Exceptional 1.9% |
| Immigrants | Serbia | 95.8 /100 | #117 | Exceptional 1.9% |
| Spanish | 95.5 /100 | #118 | Exceptional 1.9% |
| Iroquois | 95.1 /100 | #119 | Exceptional 1.9% |
| Immigrants | Bulgaria | 94.6 /100 | #120 | Exceptional 1.9% |
| Immigrants | Croatia | 94.5 /100 | #121 | Exceptional 1.9% |
| Cree | 94.5 /100 | #122 | Exceptional 1.9% |
| Immigrants | Kuwait | 93.9 /100 | #123 | Exceptional 1.9% |